
 Bruce Janda

In today's ever-evolving world, businesses must stay up to date with the latest industry trends and regulations. One area that has garnered significant attention is carbon emissions in the pulp and paper industry.
Let's take a closer look at the tissue and towel sector specifically and how producers can work towards a carbon-free process.
Overview of Current Industry Carbon Emissions
When using data from FisherSolve to examine the emissions from pulp and paper machines based on major grades, we can see that tissue and towel products account for 14% of the global industry.
Pulp and Paper Machine Emissions by Major Grade

Source: FisherSolve
With such significant levels of carbon emissions, it remains crucial for tissue and towel producers to have a comprehensive understanding of their position to fulfill consumer demand and adhere to government regulations for cleaner, low-carbon processes.
We can first start by taking a look at the percentage of emissions produced by tissue machines in each region. As we can see in the image below, Asia Pacific produces more than half of those emissions, with North America and Europe both making up 16%.
Tissue Machine Emissions by Region

Source: FisherSolve
Focus on Machine Operations
To gain a deeper understanding of the challenges and possibilities for decarbonization in the tissue and towel industry, it is essential to closely examine the operations of the machines themselves.
By analyzing the data provided by FisherSolve's Carbon Benchmark Module, we can see that the average emissions ratio is 10:1 of CO2 per FMT (metric ton of fiber) produced.

Source: FisherSolve
There are thousands of tissue machines across the globe, each offering immense potential for improvement and optimization. One factor that can greatly influence their efficiency is the type of site it is and its integration of fiber.
Integrated sites, being larger powerhouses, have the advantage of being more efficient. These sites invest in and utilize the benefits of biomass fuel, adding to their sustainability and eco-friendly practices.
A great example of this is Essity's Lilla Edet mill, which now produces tissue with zero fossil fuel emissions. Essity successfully transformed their older 3-machine tissue mill into a carbon-free facility by exclusively utilizing 100% recycled materials. This transition included several key initiatives, including:
- Adding a new biomass boiler in 2021 that uses renewable fuels such as wood chips and bark to generate heat and electricity.
- Implementing biogas in 2022 to power the mill.
- Adding a new heat recovery system in 2022 that captures waste heat from the drying process to use to heat other parts of the mill.
Decarbonization Opportunities and Concerns
When searching for opportunities to reduce carbon emissions, it is important to recognize that the location of the mill is a significant factor in determining carbon content. This is primarily because the availability of what electric grid the area has will have a substantial impact.
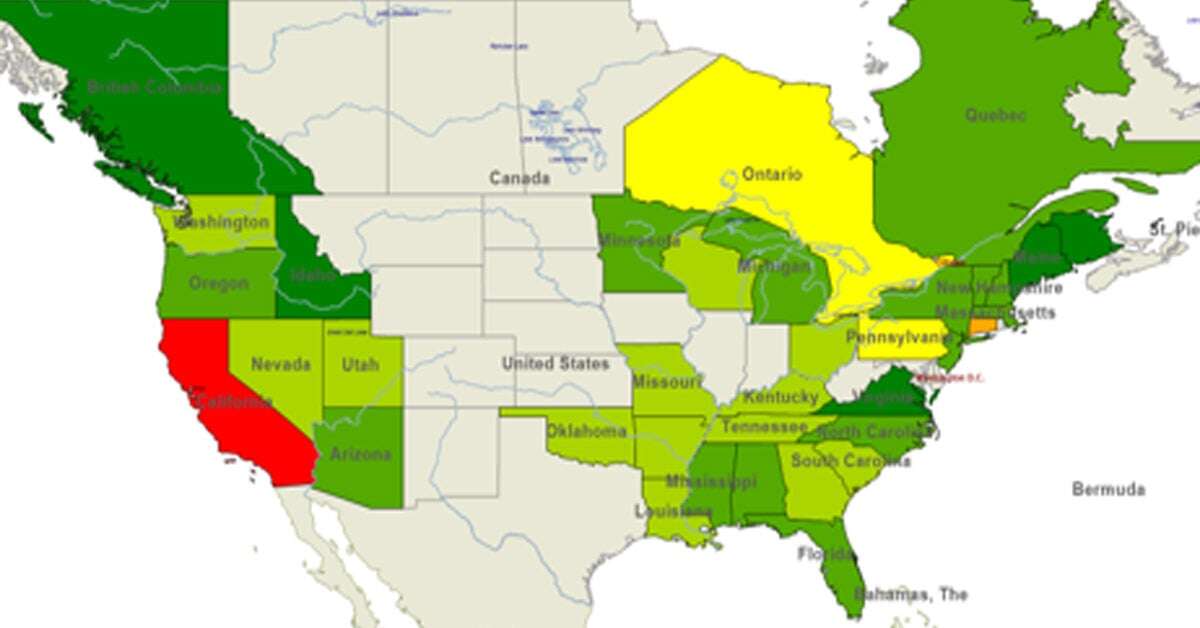
When examining Scope 1 emissions, which refer to the fuel used on-site, California emerges as a state with high levels of carbon emissions in the United States. This is largely because California's gas fuel includes electric power.
Scope 1 Emissions in North America
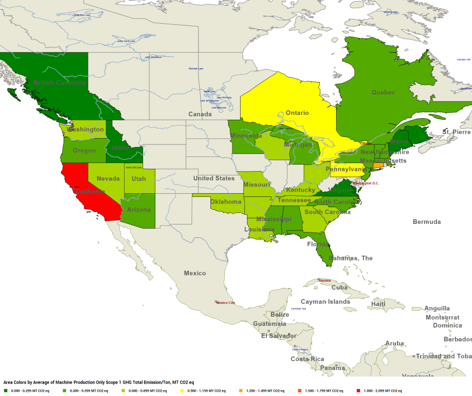
Source: FisherSolve
However, when we look at Scope 2 emissions, which is purchased power, Wisconsin, Utah, Kentucky, and Missouri are labeled as the highest-emitting states. This is because these states tend to use more coal power, whereas Canada and the US Northwest use waterpower.
Scope 2 Emissions in North America

Source: FisherSolve
When considering Scope 1 emissions, the intensity of fuel consumption in gigajoules (GJ) generally correlates to carbon intensity. When comparing different types of sites and technologies within the tissue and towel industry, Advanced Tissue Technology (TAD) machines have higher carbon and fuel intensity. Integrated fiber sites possess lower carbon intensity per power intensity, while virgin fiber integrated sites exhibit lower carbon intensity overall.
When considering Scope 2 emissions, the intensity of power consumption in gigajoules (GJ) generally corresponds to the carbon intensity. Similarly, TAD machines exhibit higher power and fuel intensity when comparing emissions. However, it is worth noting that these emissions are not as significant when the machines are integrated into pulp sites.
On-site or nearby sources make it easier to envision the use of biogas. However, there are also new and exciting developments in the form of hydrogen hubs, which are being explored by the USA DOE. These hubs will test the decarbonization of hydrogen production, with some using fossil fuels and others relying on green-powered methods.
Ammonia is also another option for energy transportation, although the burning of ammonia is not yet well developed.
The image below illustrates hydrogen costs projected by the US DOE. Cost is the largest issue. Although they are forecast to fall, that’s not a 100% guarantee.
Hydrogen Costs per Tissue FMT

The rise of renewable power has had a significant impact on baseload generators, creating challenges for power storage. The situation is further complicated by the fact that battery storage solutions are currently limited in their capabilities.
To address this issue, an increased deployment of renewable energy sources is required to replace traditional base load systems. However, this transition comes with added costs and risks. The "Duck Curve" phenomenon in California illustrates how renewable solar power can shift the net base load demand, rendering existing base load systems economically unviable due to reduced operation times.

Source: US Energy Information Administration
What Is Possible Right Now?
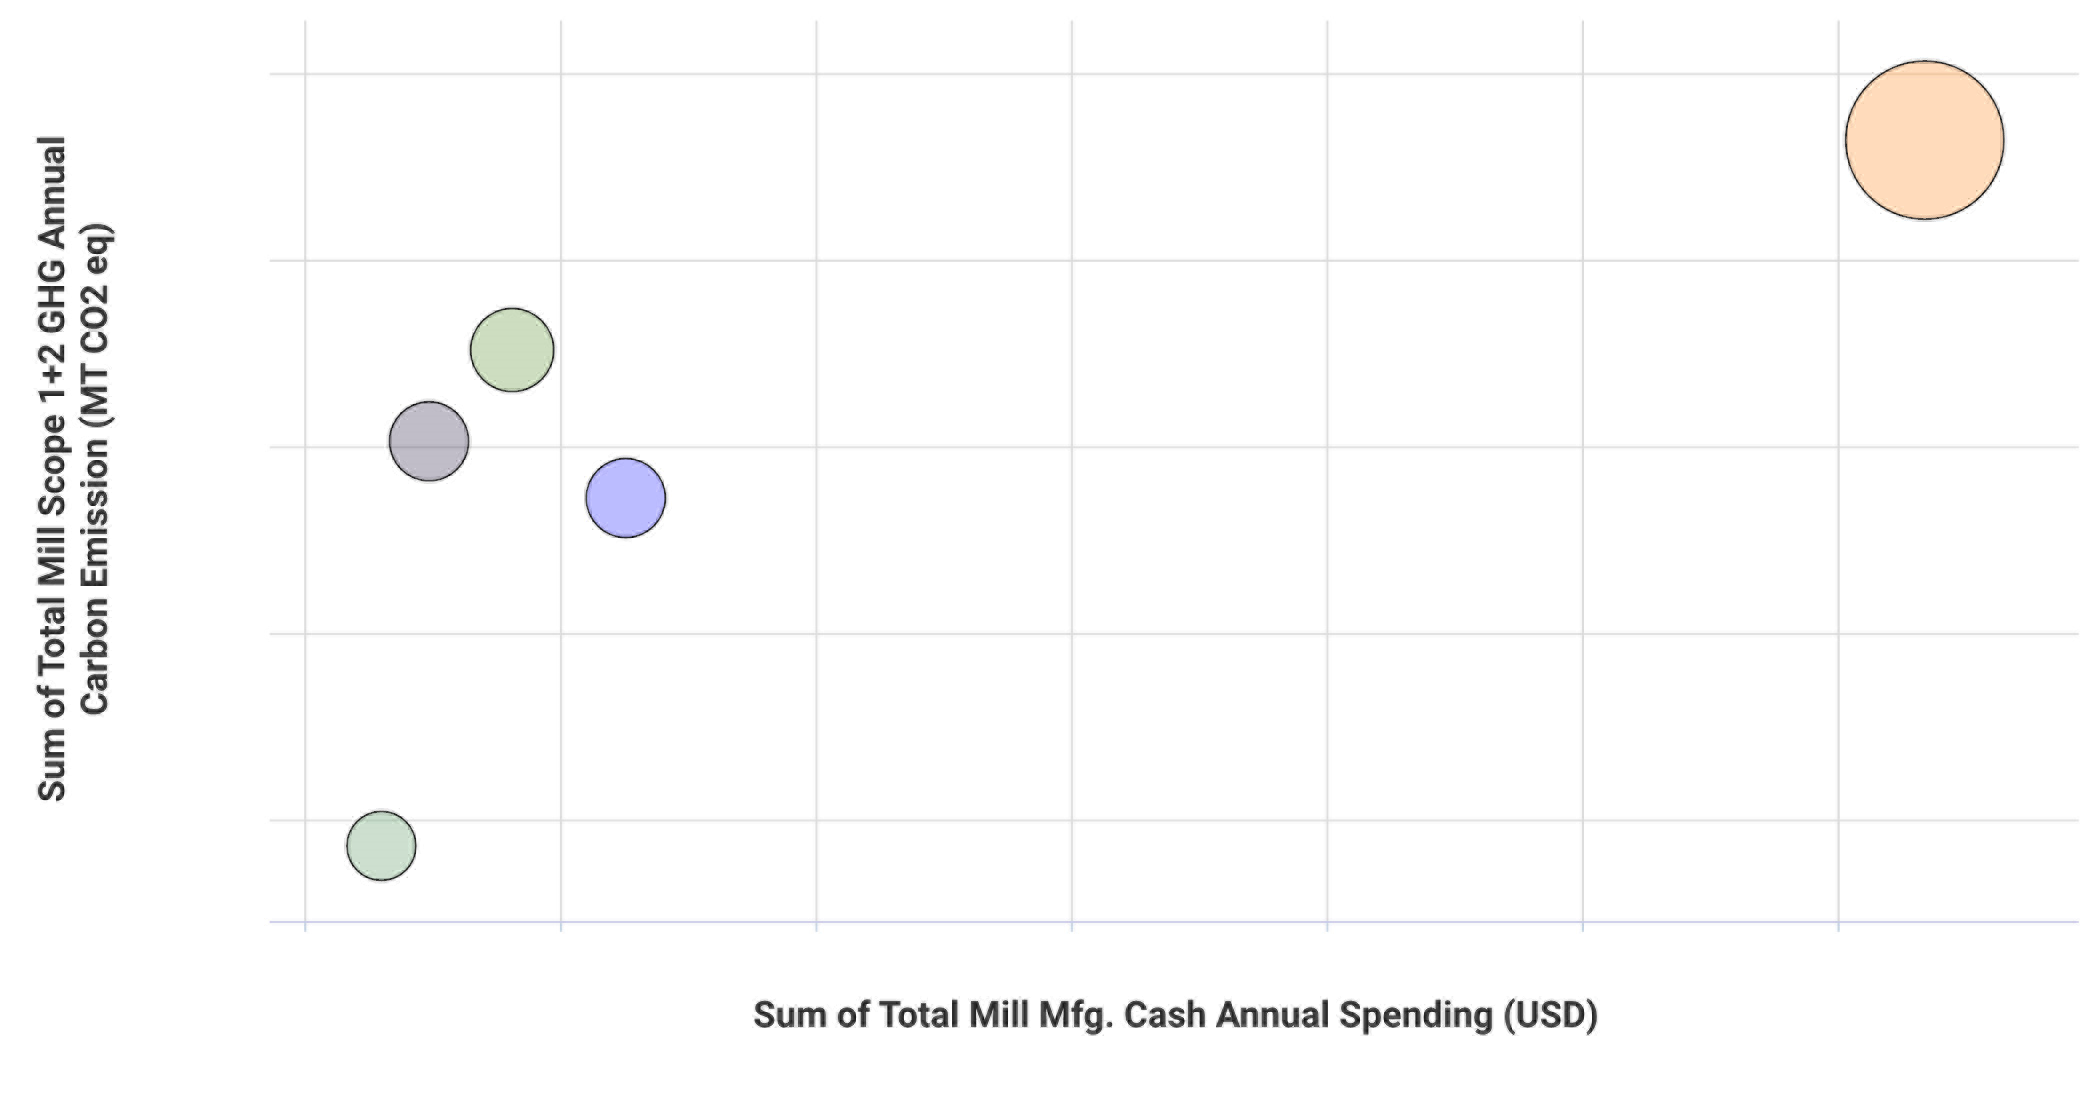
The graph below compares North American tissue technical ages versus the Scope 1 and Scope 2 carbon emissions they produce. The blue circles represent advanced technology (mostly TAD) and the orange circles represent conventional wet-pressed technology. Circle size is tons/year for each tissue machine.

Source: FisherSolve
Upon analyzing this comparison, it becomes evident that advanced technology exhibits higher carbon emissions per ton. However, the trend lines illustrate that newer machines are showing improved carbon emissions per ton. Interestingly, advanced technology carbon emissions are actually improving at a faster rate compared to conventional machines.
For tissue and towel producers looking to decarbonize their operations, one effective starting point is upgrading their process equipment. Take, for instance, the comparison between a shoe press and a roll press. The shoe press outperforms the roll press by using less drying energy and achieving a higher production rate.
While the transition to low-carbon or net-carbon tissue and towel production may seem like a daunting task, it is important to remain optimistic about the long-term benefits. Essity has already proven that fossil fuel-free production is possible, and reducing the total carbon emissions produced each year is a global climate goal.
To measure progress in achieving this goal, we need to consider the CO2/FMT metric, which measures carbon intensity. Finding ways to effectively report on carbon intensity will be key in driving further advancements in low-carbon practices. Carbon intensity includes site location and local power grid carbon, site fuels, and process energy efficiency and waste.
Take Your First Steps to Decarbonization with ResourceWise
ResourceWise offers a range of products to help you assess not only your carbon footprint and strategies for decarbonization but also the overall sustainability and profitability of your mills.
FisherSolve’s Carbon Benchmarking Module
By utilizing our Carbon Benchmarking Module in our FisherSolve database, you gain the power to evaluate your mill's emissions across Scope 1, Scope 2, and Scope 3, from cradle to gate. This module provides you with accurate comparisons of your mill's GHG emissions to others in the industry, allowing you to identify the main sources of your carbon footprint.
The valuable insights gained from this benchmarking process empower you to confidently strategize and implement measures that effectively reduce your emissions. With this information, you can easily determine the threshold you need to meet to remain competitive in terms of emissions among other mills in your industry. Learn more.
Prima CarbonZero
Gain a deeper understanding of the cost of implementing low-carbon solutions for your business operations with the insights provided by our Prima CarbonZero platform. Specializing in pricing carbon and low-carbon fuel markets, Prima CarbonZero offers invaluable knowledge on the green carbon value proposition for pulp and paper mills.
This platform not only provides mills with a comprehensive understanding of the potential value and opportunities in their green carbon product streams but also helps explore how these residual streams can be transformed into future fuels. By leveraging Prima's expertise, pulp and paper companies can maximize returns as policies drive the demand for low-carbon fuels into high gear. Learn more.


DOE’s Updated 45Z GREET Model Brings Clarity to US Biofuels Markets

EUDR Compliance in 2026: Why Traceability Has Become a Competitive Advantage
Decarbonization Opportunities and Challenges in the Tissue and Towel Industry
In today's ever-evolving world, businesses must stay up to date with the latest industry trends and regulations. One area that has garnered...
France Tissue Business Report: Consequences of 2022 Energy Disruption
In a time of extraordinary price disruption, 26 of France’s 56 aging reactors are offline for maintenance and 18 are down with labor strikes. The...
Pioneering Green Hydrogen in Tissue Manufacturing
Like many industries, the global pulp and paper sector is focusing on developing innovations to address the urgent requirement for decarbonization to...