 Bruce Janda
When we last focused on Germany's tissue market more than two years ago, the world was dealing with the severe disruptions of the Covid-19 pandemic. However, since then, businesses have reopened as the number of cases began to decrease. As we began to return to our altered normalcy, it was difficult to imagine a more significant disruption to tissue manufacturing and consumer consumption than what we had just experienced. Yet, the Russian/Ukraine war that occurred in early 2022 has surpassed the pandemic disruptions due to the extreme interruption it created in Europe’s energy supplies. This analysis will focus on how the war’s impact to energy supply and cost have affected German and European tissue production and future viability.
Despite Germany being the largest economy in Europe and the fifth largest in the world, the high costs and decreased availability of energy, especially natural gas, affected numerous aspects of society. German tissue makers like Hakle had to declare restructuring due to the extreme energy cost challenges that occurred just before winter. Tissue manufacturers requested additional energy price caps and warned of potential tissue paper shortages. Fortunately, the winter of 2022-2023 was much warmer than expected, and Germany is now forecasting economic growth of 0.2% for the rest of 2023 instead of a recession. Strong headwinds remain as other trading partners forecast recessions in 2023 and domestic energy cost subsidies are withdrawn.
Germany’s adjusted GDP per person trend is shown in Figure 1. 2009 (Great Recession) and 2020 (Covid-19) were the only years that experienced a decline in economic growth in this trend. Germany went through a slight decline in population from 2008 through 2011, but the population growth resumed thanks to increased immigration until it reached a pause in 2022. Both the population recovery and economic growth provides good support for continued tissue consumption in normal times. Still, the German consumer is under the same energy pressure as the tissue mills.

Source: FisherSolve
German inflation and unemployment trends are shown in Figure 2. The unemployment trend has been very favorable, sitting at about 3.5% currently, and the burst of inflation that occurred in 2022 due to the energy price disruption is dissipating. However, the country is an export-focused economy, and this positive economic news does not account for the energy pressures on Germany’s trading partners.
Figure 2: Germany Inflation and Unemployment

Source: FisherSolve
Tissue import and export trends are shown in Figures 3 and 4. Imports and exports are generally balanced and have slightly decreased in the past several years. Most of the tissue trade with nearby neighboring countries is two-way.
Figure 3: Germany's Tissue Import Trends

Source: FisherSolve
Figure 4: Germany's Tissue Export Trends

Source: FisherSolve
The effect of the mature and slow-growing German tissue business is shown in Figure 5, illustrating that there is no net change in the size of the tissue machine fleet. New tissue machines were added in 2008 and 2015, followed by older machine shutdowns in 2009 and 2016. These new machines were more productive than the machines removed, and existing machine improvements and de-bottlenecking supported the remaining domestic growth.
Figure 5: Germany Tissue Machine Count Changes

Source: FisherSolve
About 60% of tissue mills have integrated recycled paper fiber production on-site, as shown in Figure 6. About 25% of tissue sites are non-integrated using market pulp. The rest of the sites are virgin fibred integrated with fiber production on-site. Integrated tissue production sites tend to have lower costs.
Figure 6: Germany Tissue Site Type

Source: FisherSolve
Figure 7 shows the source of tissue fibers for all the mill integration types. In addition to the recovered paper recycled fiber, Germany uses a significant fraction of non-wood short fiber and CMP/BCTMP lower-cost fibers. The proportion of bleached kraft northern softwood and eucalyptus used in tissue is smaller than many of Germany’s neighbors. This makes for a lower cost furnish that offers somewhat lower consumer qualities such as softness and absorbency.
Figure 7: Germany Tissue Fiber Sources
 Source: FisherSolve
Figure 8 shows that Germany has a strong commercial tissue business mainly focused on towels for hand drying. The consumer tissue segment shows strong production of bath and facial tissue and towels for household cleaning.
Figure 8: Germany Tissue Finished Products
 Source: FisherSolve
Consumer and commercial toweling are important as it drives applying advanced tissue technology for towel production to yield absorbency gains with less fiber consumed per drying instance. This applies to commercial toweling for hand drying and consumer home towels for cleaning and spill recovery. Figure 9 shows that a small amount of German production uses advanced technology to texture and shape the tissue before drying. This technology is employed exclusively for towels, as shown in Figure 10. This is normal for Europe compared to North America, where advanced technology is also used for bath and facial tissue. The difference in consumer requirements for strength and softness optimization makes advanced technology a requirement in North America for tissue integrity at very low strength. The higher bath and facial tissue strengths in Europe do not require advanced technology to make consumer-preferred products.
Figure 9: Germany's Tissue Technology

Source: FisherSolve
Figure 10: Germany 's Advanced Tissue Production
.png?width=600&height=329&name=Figure%2010%20Germany%20Advanced%20Tissue%20Production%20(1).png) Source: FisherSolve
Source: FisherSolve
The following benchmark analysis of German tissue production uses a comparison set of tissue-producing countries selected from trade partners shown in Figures 3-4. The selected producers include Austria, Belgium, France, Italy, Netherlands, and Sweden. The United States was added to the set to compare to lower energy costs outside the Eurozone.
Figure 11 benchmarks tissue machine quality. The size of the bubbles represents the total production capacity of each country versus the average tissue machine technical age on the X-axis and the average machine trim or width on the Y-axis. Italy and Germany have the most up-to-date tissue machines on average in this set. German tissue machines tend to be wider than Italian machines, but significantly narrower than the older machines in the United States.
Figure 11: Germany Tissue Machine Quality
 Source: FisherSolve
A similar style comparison is shown in Figure 12 for water consumption and water risk. Again, the size of the bubbles represents the tissue capacity of each country. Germany uses the least amount of water to produce a ton of tissue compared to all the other examples. The United States provides a counterpoint in water consumption at about five to six times the average German consumption. Therefore, Germany is rated a relatively low water risk.
Figure 12: Germany's Water Consumption and Water Risk

Source: FisherSolve
Benchmark average tissue ton production cash costs are shown in Figure 13. The width of each bar represents the total tissue production tons for each country, and the height of each bar represents the average cost to produce a ton. Germany tends to have a slightly higher cost than Sweden, Italy, France, and Austria. However, Belgium and the Netherlands are relatively high-cost producers. The stacked color bars provide reasons for the cost differences observed. The United States shows the lowest energy costs as the yellow bar in the stack. France also has very low energy costs due to the French focus on nuclear electric power generation. Germany has relatively low fiber and pulp costs, but the average German energy costs are more than double the cost per ton of the United States or France. Austria, Germany, and the Netherlands see the highest energy costs in this comparison.
Figure 13: Germany 2023 Benchmark Costs

Source: FisherSolve
Figure 14 benchmarks the total energy cost per ton of tissue production to dig further into the energy cost differences. The energy cost for on-site fuel and steam is relatively low for the United States, France, and Sweden. France, Italy, and the United States also benefit from low grid electricity prices.
Figure 14: Germany Tissue Viability - Rank Curve by Country
 Source: FisherSolve
It is too soon to say how these energy costs will settle as the Eurozone and the world adapt to the new wartime energy situation. The post-war energy cost structure is expected to focus on sustainability and decarbonization. The countries have adapted by temporarily reopening carbon-intensive energy sources like lignite or coal. However, much was done to advance low-carbon and renewable energy. The Economist magazine projects that “as a happy consequence, the green transition may have accelerated by five to ten years.” Although German tissue producers are probably not as happy looking at this chart.
Figure 15 illustrates the cost per ton of energy, and energy prices are somewhat subsidized by the different tissue-producing companies distorting the comparison and future prediction. Figure 16 shows the same chart, except that the cost of energy used per ton of tissue production is replaced by the units of energy required per tissue ton.
Figure 15: Germany's Energy per Ton - Energy Curve by Country
 Source: FisherSolve
German tissue production still uses more energy units (GJ) than everyone else except the United States. North America is relatively energy self-sufficient and has not seen the energy cost pressure of the Eurozone countries. American consumers and tissue producers may disagree, but they haven’t seen the energy shortages or price disruption from the war on the same scale as Europe. Both the United States and Germany have tissue energy reduction work to do.
Figure 16: Germany's Energy GJ per Ton
 Source: FisherSolve
Figure 17 benchmarks carbon emissions directly using Scope 1 (fuel burned on site) and Scope 2 (electricity purchases). This chart is driven using fuel by units (GJ) like Figure 16 versus Figure 15 costs. Again, the United States is far above the average emission rate per ton, and Germany is slightly elevated. The opportunity shown for Germany is reducing the larger rate of Scope 2 emissions as high-carbon fuels are withdrawn again and replaced by lower-carbon natural gas and zero-carbon renewables.
Figure 17 Germany Benchmark Carbon - Carbon Emission Curve by Country
 Source: FisherSolve
Scope 3 emissions are upstream and downstream of the tissue production and include fibre production in market pulps. This could be interesting if included in the carbon emission measurement. It would benefit advanced tissue processes if they reduced the basis weight and carbon content of the pulp required if measured on a consumer-use basis.
Germany’s tissue business continues in a slow-growth stage, with machine replacements and upgrades focused on cost and quality improvements. Germany is an active tissue trader with its neighbors but is currently disadvantaged by energy costs and carbon emissions compared to the average of the trade group. The war energy supply disruption has exacerbated these issues. Still, there is also hope that the rate of decarbonization has accelerated, and this analysis could look much better for Germany in two to three years.
This analysis looks at a snapshot of German and western European tissue-making based on country averages in an extraordinary time of energy price shocks and supply chain disruption.
Analysis of competitive position requires specifics on tissue producers and individual machines. This article presents a static picture summary of Germany’s tissue industry today. Fiber prices, exchange rates, and environmental regulations will change, providing some participants with advantages and others with new challenges. Spanish tissue mills will continue to change hands and perhaps consolidate; neighboring countries may invest in tissue-making capacity, thus affecting Germany’s imports and exports.
For a further understanding of the global tissue market, download our 2022 Global Tissue Study below.


.png)
Cross-Border Trade in Resource Industries: Structuring for Risk and Compliance
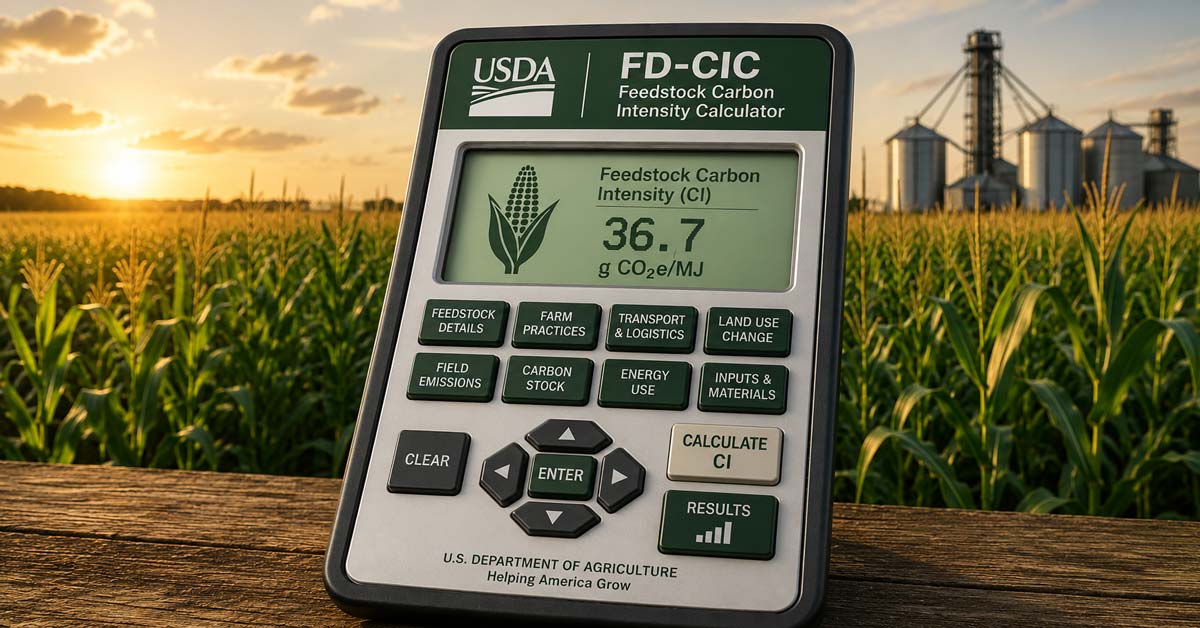
Explainer: Getting to Know the USDA's Feedstock CI Calculator
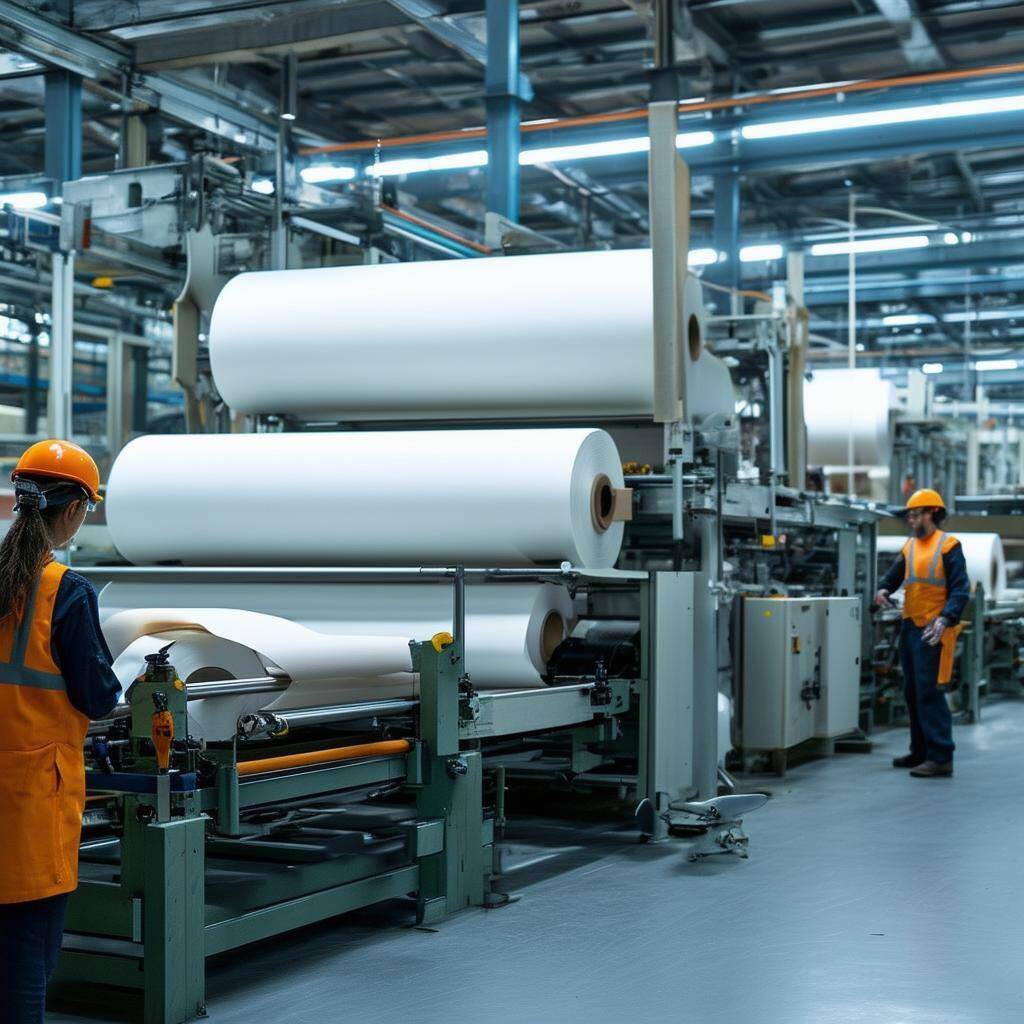
Germany's Tissue Market: Challenges, Growth, and the Road Ahead
Germany’s tissue industry is at a crossroads. While technological advancements have driven capacity growth at a compound annual growth rate (CAGR) of...
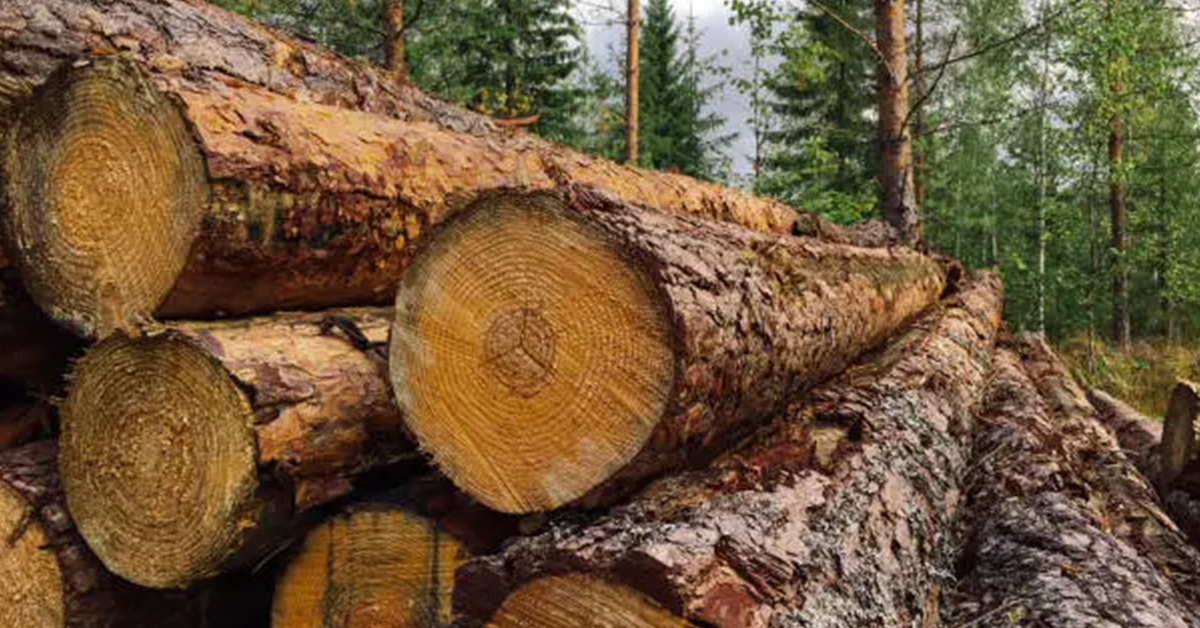
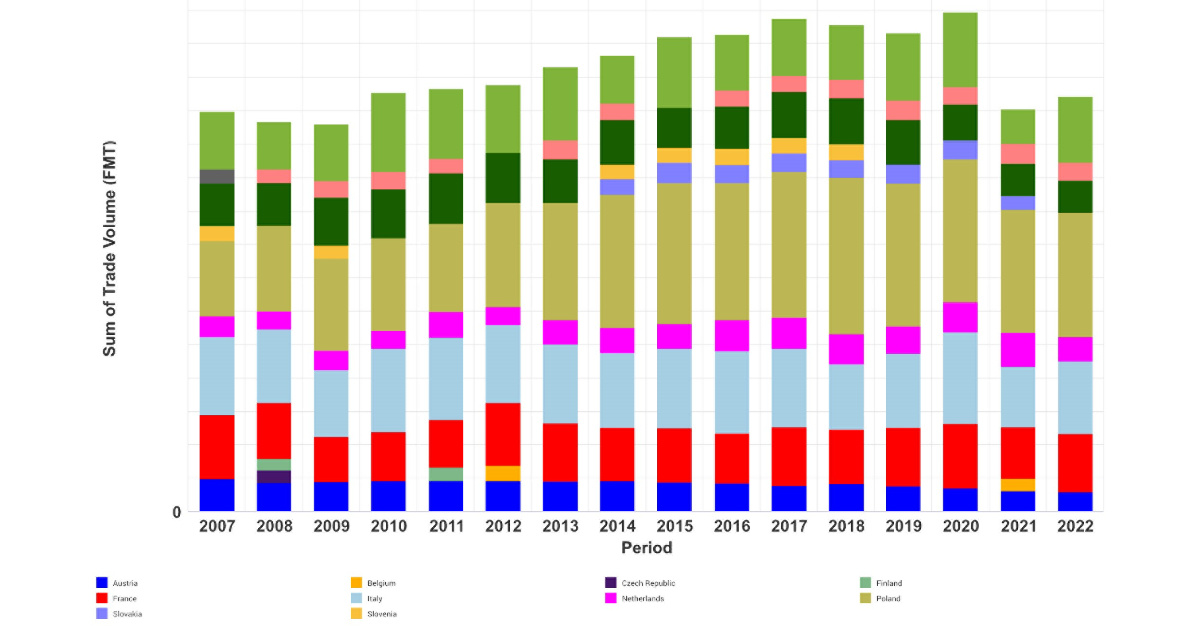
Germany’s Softwood Log Market Tightens as Prices Rise and Trade Shifts
Germany remains one of Europe’s most influential forest products markets. As the backbone of domestic sawmilling and a key driver of regional trade...
Analyzing Africa’s Tissue Industry: Current State and Future Prospects
In the evolving global market, identifying opportunities for growth and understanding various industry complexities is key. This is particularly...