
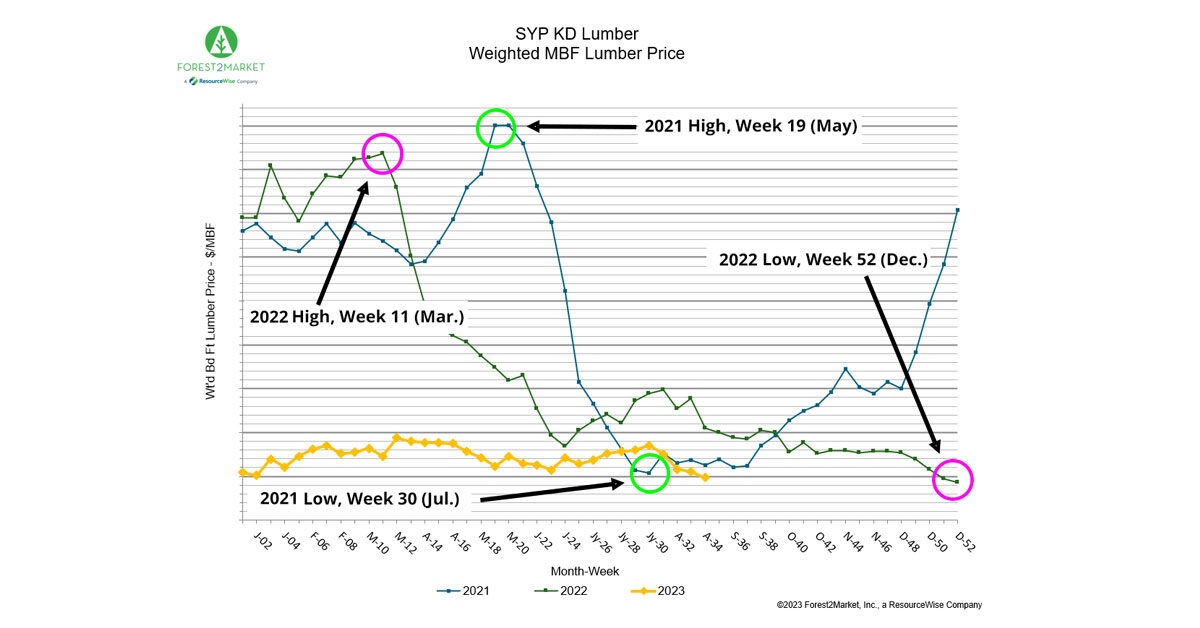
Reported SYP KD lumber prices have dropped to the lowest level so far this year. According to ResourceWise data, the price dipped just under $400/MBF, reflecting a 15% dive from just a month ago.
While 15% is by no means a small change, remember to look at these numbers contextually. As the graph shows, the decrease here reflects generally steady SYP lumber prices throughout 2023.

We’re seeing variance between $400 and $500 with the highest values occurring in March followed by a few ups and downs until August’s low. Compare these prices with the monumental spikes seen in 2022 and 2021.
.jpg?width=600&height=438&name=syp-lumber-aug-2023-2022-2021-comparison-(1).jpg)
The differential from high price to low in 2022 was -$700, a 66% decrease. 2021 was even worse with a -$750 differential from high to low, seeing drops also as sharp as 66%.
The data reveals that the prices we’re seeing this year on SYP lumber are far less volatile than even just a year ago. Nevertheless, a 4-week downward pricing trend brought the number to where it currently sits.
Industrial Production Aligns with Decreased SYP Lumber Prices
Some connections to economic data in industrial production and manufacturing can partially account for the drop in lumber prices.
The table below shows total industrial production (IP) declining 0.5% in June for a second consecutive month. Also, remember that May was revised down from ‑0.2%.

Total IP fell 0.4% year-over-year (YoY) in June, the first back-to-back YoY decline since February 2021. On a brighter note, total IP advanced at an annualized 0.7% during 2Q. In June, the indexes for mining and utilities fell 0.2% and 2.6%, respectively.
Manufacturing output moved down 0.3% in June (also -0.3% YoY). During the 2nd quarter, factory output advanced at an annualized 1.5%, supported by a 36.7% quarter-over-quarter (QoQ) jump in the production of motor vehicles and parts.
New factory orders increased 2.3% in June but reflected a -0.2% YoY decrease. This extends the annual decline we also reported for May. Excluding transportation, growth in new orders was a more modest 0.2%, or -5.3% YoY. Business investment spending edged up 0.1% for a +1.5% YoY change.
ResourceWise forecasts QoQ changes in total IP to range between ‑4.1% and +2.1% annualized rates during the next 24 months and an overall average of -0.1%.
Manufacturing Reflects Ongoing, Albeit Slowing, Decline
On the manufacturing side, we’re still seeing contraction—albeit at a slower pace.
The Institute for Supply Management’s (ISM) monthly sentiment survey of U.S. manufacturers reflected a slower contraction in the sector during July. The PMI registered 46.4%, up 0.4 percentage points (pp) from June’s reading. 50% is the breakeven point between expansion or contraction.
All subindexes remained below 50, heartily affirming a continued contraction. The largest changes occurred among the following:
- Order Backlogs: +4.1pp
- Employment (-3.7pp)
- Customer Inventories (+2.5pp)
- Inventories (+2.1pp)
Debate Continues Despite Strong Indicators of Recession
Interestingly, the on-paper resistance to acknowledging a recession perseveres among many economists and manufacturers alike.
As we reported in July, all major indicators see the same thing: we’re at the beginning of a recession. Specifically, we’re in phase 1 of the Incrementum Recession Phase Model.
Related: The Verdict's Out: We're in the Starting Phase of a Recession
This early phase acts much like the “where there’s smoke, there’s fire” trope. We’re seeing lots of smoke in way of economic and manufacturing trends. As the smoke thickens, that can only mean one thing: a fire is building.
Even if the recession debate remains unsettled at the time of this blog’s publication, one thing is certain. The 3rd quarter started off with weakened economic growth. The next several weeks are pivotal in assessing how the final months of 2023 could play out.
As Chris Williamson furthered, “…the overall message from the surveys is that economic growth weakened at the start of 3Q, cooling to an annualized rate of around 1.5%. The survey’s price gauges, however, continue to signal a stubbornness of inflation around the 3% mark.”
Key Forestry Insights and Expert Data from ResourceWise
ResourceWise will continue to monitor all critical economic indicators relative to forestry, including lumber and other forest product prices.
Don’t fall behind on the latest news and trends impacting your business. Learn more about ResourceWise's suite of pricing, data, and analytics solutions to see how they can empower your organization.


Crude Tall Oil Is Gaining Value in Low-Carbon Fuel Markets

How SAF Demand Is Reshaping Forest-Based Feedstock Markets
Analyzing North American Lumber Prices
In recent years, North American lumber prices have experienced significant fluctuations with prices in late 2023 nearing levels seen a decade ago. By...
2023 Recap: SYP KD Lumber Prices Fall to 2019 Lows as Economy Slumps
As 2023 finishes out, SYP KD lumber prices have steadily fallen to levels not seen since 2019. With economic factors showing a potential recession on...

Big Hike in US Duties on Canadian Lumber Shifts More Weight of Weak Market to Canada
The US and Canada have had a long-standing trade dispute over softwood lumber. The US government has backed its lumber industry’s view that Canadian...