Economic conditions have inched up in several key indicators. But global conflicts and persistent inflation position us on the brink of recessionary contraction. Where does the forest products industry stand in relation to these factors?
Small but Steady Industrial Production Increases
According to the Federal Reserve, total industrial production (IP) increased 0.4% in August, a +0.2% rise year-over-year (YoY). Manufacturing output also inched up 0.1% for a second consecutive MoM gain.

(Source: Federal Reserve)
Manufacturing was held back by a drop of 5% in the output of motor vehicles and parts. Factory output elsewhere rose 0.6%.
US census data indicates new factory orders rose by 1.2%, led by nondurable goods. The gain in business investment spending accelerated to +0.9% (+0.6% YoY).
Despite the overall upbeat August results, 4Q 2023 outlooks may suggest more challenges ahead. Interest increases will mean even stricter credit restrictions. This will assuredly mean investment woes and some waning of economic growth.
We are forecasting quarter-over-quarter (QoQ) changes in total IP to range between ‑1.1% and +2.4% annualized rates during the next 24 months. The overall average will land at +0.3%.
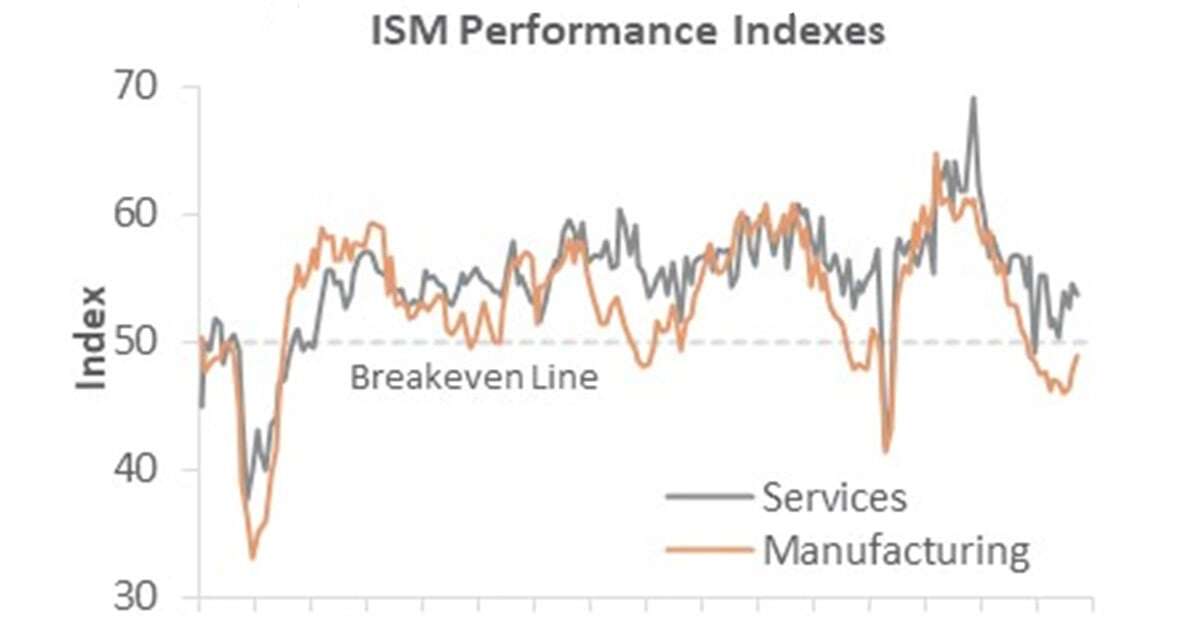
Manufacturing Surveys Reveal Continued Slowdown of Contraction
The Institute for Supply Management’s (ISM) monthly sentiment survey of U.S. manufacturers reflects a slowing down of the overall contraction. This is on pace with prior months, and it's good news considering the delicate state of the current economy.
To be clear, a slowdown in contraction should not suggest a net increase. Instead, it means that the overall decrease of manufacturing output is occurring at a slightly slower pace than we’ve seen in the last few months.
Related: Manufacturing and Industrial Production Show Very Slight Increases
The PMI registered 49.0%, up 1.4 percentage points (PP) from August’s reading. 50% is the breakpoint between contraction and expansion. As these numbers trickle upward, we are coming close to this crucial breakeven point.

Only the production and employment subindexes popped above 50. The largest changes occurred among prices paid (-4.6PP), employment (+2.7PP), and production (+2.5PP).
Various figures within the services sector also slowed—albeit at a somewhat slower rate. Order backlogs (+6.8PP), inventory sentiment (‑6.7PP), and new orders (-5.7PP) exhibited the largest changes. With order backlogs contracting more slowly, inventories still perceived as too high, and new orders tapering off, service providers are facing a challenging environment.
Materials Supply Improving, but Inflation, Export Woes Still at Play
Overall manufacturing in September did enjoy some stabilizing of conditions and economic indicators. However, inflation continues to affect pricing and worsening buyer confidence.
Costs for producers rose rapidly in recent months, likely responding to a spike in oil prices. The price means higher costs for manufacturers. This will, of course, inevitably make its way to consumers, worsening the inflationary pressures already felt.
Additionally, production growth itself extended the slumps we’ve seen over the past several months. New orders were down, mostly from a weakening of exports. This seems to affirm a more general cooling down of the economy after some unexpected summer growth.
Some forecasts call for a potential improvement on export volume. But worsening international conditions from the Israel-Hamas war will have a myriad of economic effects we’ve yet to see.
Modest Increases in Consumer and Producer Price Indices
The consumer price index (CPI) rose 0.6% in August (+3.7% YoY). The index for gasoline, at +10.6% month-over-month (MoM), accounted for over half of the all-items increase. Other major contributors included the following:
- Shelter Index: +0.3% (40th consecutive monthly rise)
- Energy: +5.6%
- Food: +0.2%
Meanwhile, the producer price index (PPI) increased 0.7% MoM, a +1.6% YoY rise.
August's MoM advance is the largest increase in final-demand prices since June 2022’s +0.9%. Roughly 80% of the August rise is attributable to a 2.0% jump in the index for final demand goods. This was led by a 20.0% jump in the wholesale gasoline index.
Prices for final demand services advanced 0.2%. The leader in this pack was a 1.1% increase in the index for residential real estate services—partial.
Forest Products Sector Index Data Only Rising in Wood Fiber
In the forest products sector, we’re seeing drops in all major sectors with the exception of wood fiber.
Wood fiber prices have weathered the storm and keep rising. According to Hakan Ekstrom, Director of the International Forest Products Sector for ResourceWise, the surge can be linked to lower global lumber production and residual supply.
Other products, like pulp, have rolled further downhill after hitting a record high at the end of 2022.
Related: With Volatile Global Wood Products Market, How Will Q4 2023 Play Out?
Forest products price indexes were at the following numbers in September:
- Pulp, Paper & Allied products: -0.1% (-1.2% YoY)
- Lumber & Wood Products: -1.1% (-9.4% YoY)
- Softwood Lumber: -4.4% (-18.0% YoY)
- Wood Fiber: +0.5% (-3.0% YoY)
Don’t miss out on the latest economic news affecting the forestry industry.
Subscribe to our Forest Products blog for ongoing coverage of the markets that matter to your business.


Bio-Bunker Premiums Rebound as Oil Market Disruption Eases

45Z Final Rules are Coming in November. Now is the Time to Plan.
Economic Conditions Remain Unchanged, How Does This Impact the Forest Products Industry?
With economic conditions showing little variation, the forest products industry finds itself at a crucial juncture due to global conflicts and...
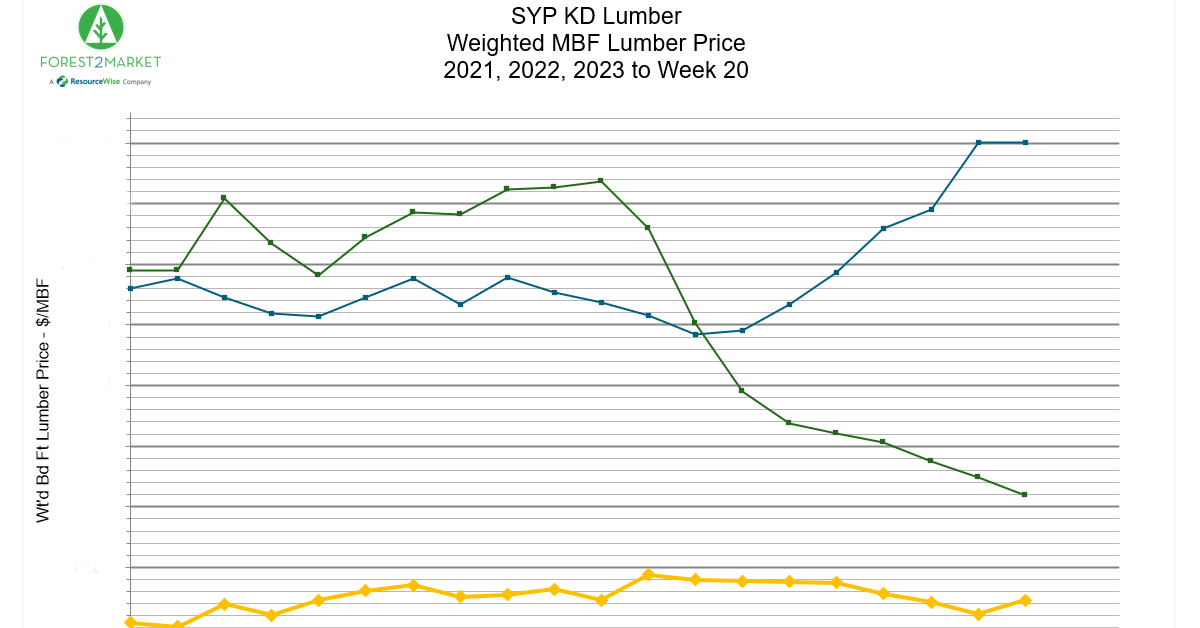
SYP Lumber Prices Steady as Housing and Manufacturing Improve
SYP lumber prices have held somewhat steady across 2023 thus far. Price variance is far below the meteoric rises and falls of 2022 and 2021. Some...
Nordic Sawmills Have Some of the Lowest European Sawlog Costs
Record-high lumber prices in North America and Europe have moved both demand and sawlog values to some of the highest levels seen since WRQ started...