 Bruce Janda
Latin America is characterized by a vibrant Latin culture that transcends geographical borders. It is important to recognize that this rich Hispanic culture is diverse, with unique variations in food, music, and societal aspects across different nations. These cultural nuances should be expected to influence tissue demand in the region.
In a recent analysis, we focused solely on the tissue and towel market of Brazil. However, today, we will broaden our focus to explore the rest of the region.
An Overview of Latin America's Socioeconomic Factors
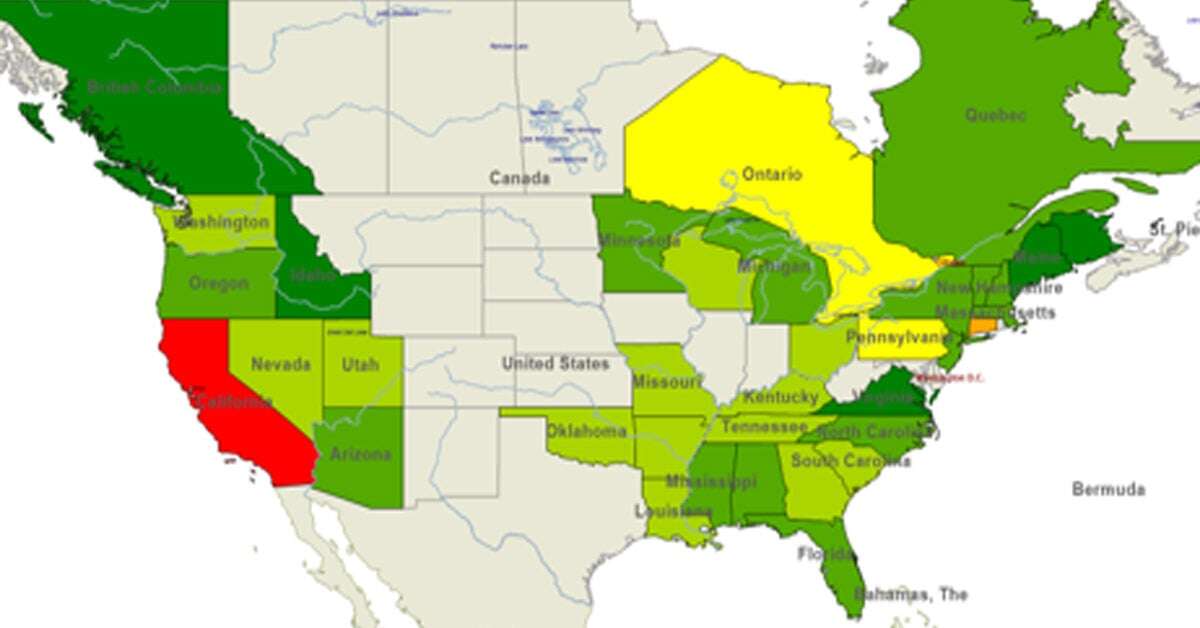
The heatmap displayed in Figure 1 offers a visual representation of tissue production in Latin America. It highlights Mexico and Brazil as the leading producers. Following closely behind are Colombia and Argentina.
Figure 1: Latin America Tissue Production by Country

Source: FisherSolve
Further in the report, Figure 7 also shows Latin American tissue production but in a pie chart. This figure ranks the relative production volumes without Brazil.
Cuba, the Dominican Republic, and Trinidad & Tobago are identified tissue producers in the ResourceWise database. Given the many small islands, determining the countries included in Latin America for economic and trade statistics poses a challenge.
A comprehensive overview of economic indicators influencing or impeding the development of tissue consumption is depicted in Figure 2. This image showcases the trend in Latin American population and GDP growth.
Figure 2: Latin America's Yearly Population and GDP Trend

Source: FisherSolve
Apart from Brazil, the population in the rest of Latin America surpasses that of Brazil by more than double. The graph displaying the average GDP per capita, represented by the blue line, illustrates significant disruptions caused by the COVID-19 pandemic. While the average consumer purchasing power aligns with that of Brazil, this average conceals a wide range of income levels.
Climate change affecting agriculture combined with economic and political disruption has driven migration to North America, resulting in instability that continues to frustrate tissue consumption development. The economic headwinds on tissue consumption growth are shown in Figure 3.
Figure 3: Latin America's Yearly Unemployment and Inflation Trend
 Source: FisherSolve
The average unemployment trend appears reasonable but hides several significant outliers. The average inflation peaked at 2,100% in 2018 and is arithmetically correct, but the massive impact of several countries’ runaway inflation distorts the average. Therefore, any tissue demand study must consider the different consumer conditions in neighboring countries.
These regional averages offer limited guidance, so the individual country’s economic statistics are also shown in Table 1. The FisherSolve economic and trade databases encompass the Latin American countries featured in the report, except Cuba. Although tissue production data for Cuba is available in other sections of this report, the economic data is taken from the World Factbook. The five-year compound annual growth rate (CAGR) is included for both income and population growth.

Highlighted in bold are the inflation rates for Argentina, Hatti, Suriname, and Venezuela. It is noteworthy that Venezuelan inflation in 2023 has significantly decreased compared to previous years, which had been distorting Figure 3. Most other countries in the region are experiencing stable inflation rates. On the other hand, Hatti has a considerably low personal income level. Additional low-income countries include Honduras, Nicaragua, and Venezuela. Conversely, countries like Aruba, the Bahamas, and Guyana can be considered relatively prosperous. Guyana, in particular, stands out with recent income growth.
Import and Export Patterns in Latin America
The tissue import trend to the Latin American region is shown in Figure 4, and the tissue export trend is shown in Figure 5. This import and export data considers Brazil as an external source or destination.
Figure 4: Latin America's Import Trend by Region
 Source: FisherSolve
Tissue imports and exports are roughly in balance for Latin America. Most tissue imports come from within Latin America or from North America (Canada and US). The same can be said for exports, but a trend toward more tissue from the Asia-Pacific region has recently developed.
Figure 5: Latin America's Export Trend by Region
 Source: FisherSolve
A Closer Look at Latin America's Tissue Production
With tissue imports and exports roughly balanced, the expansion of tissue supply depends on local tissue machine capacity and capability development. Figure 6 depicts the fluctuation trend in the addition and removal of tissue machines within the Latin American tissue machine fleet.
Figure 6: Latin America's Tissue Line Changes Trend
 Source: FisherSolve
From 2007-2025, a net increase of approximately 45 machines is anticipated. However, only about 18 old machines were removed during this period, a number lower than what would be expected in a healthy system. The newly added machines have significantly greater capacity than the old ones remaining or removed.
Several countries have made significant increases in their tissue capacity during 2007-2025. Bolivia, for example, experienced a CAGR of almost 16%, Guatemala was slightly under 9%, and Peru saw growth of less than 8%. Relative tissue capacity by country is shown in Figure 7.
Figure 7: Latin America's Tissue Production by Region
 Source: FisherSolve
Mexico boasts a tissue production that is only marginally smaller than Brazil's. Yet, its capacity surpasses that of Argentina by three to four times, making it the second-largest producer in Latin America. However, there are certain countries, like Venezuela, that are experiencing a decline in their tissue production capabilities.
Latin American tissue mill sites are mostly integrated with recycled fiber, as shown in Figure 8. Virgin fiber integration is minimal compared to North America or even Brazil.
Figure 8: Latin America's Tissue Site Types

Source: FisherSolve
Unsurprisingly, recycled integrated sites mostly use recovered papers in deinked bleached, unbleached, and unbleached not-deinked processes. Eucalyptus hardwood is the primary virgin pulp source, followed by southern softwood.
Figure 9: Latin America's Tissue Furnish
 Source: FisherSolve
Latin American tissue production broken down by finished product format is seen in Figure 10.
Figure 10: Latin America's Tissue Finished Products

Source: FisherSolve
Consumer bath tissue comprises 61% of the total output, followed by 14% of production in consumer towels. Growing more tissue consumption requires increasing towel use in the home. The instability of the region appears to deter this growth.
Exploring Tissue Machines and Technology in Latin America
When it comes to advanced tissue technology, Latin America has made modest strides. While Colombia has embraced some advanced capacity, Mexico stands out as a frontrunner in the region, aligning itself with the rest of North America in deploying advanced tissue machines of various classes. Mexico's progress in this area is further bolstered by its strong trade partnerships with Canada, the US, and the Mexico City urban market for advanced tissue products.
Figure 11: Latin America's Tissue Technology

Source: FisherSolve
The average quality of Latin America’s tissue fleet by countries is shown in Figure 12. This chart plots the average technical age of the machines on the X-axis against the average speed on the Y-axis. The size of each country’s bubble represents its total tissue capacity.
Figure 12: Latin America's Tissue Machine Quality

Source: FisherSolve
The expansion of capacity in Bolivia, Guatemala, and Peru has led to the installation of newer and more advanced machines. Among these countries, only Guatemala has machines with average speeds surpassing those in Mexico. Argentina has also been making strides in modernizing its machinery, while Mexico's growth in capacity has slowed down recently.
How Do Different Countries in Latin America Compare to Each Other?
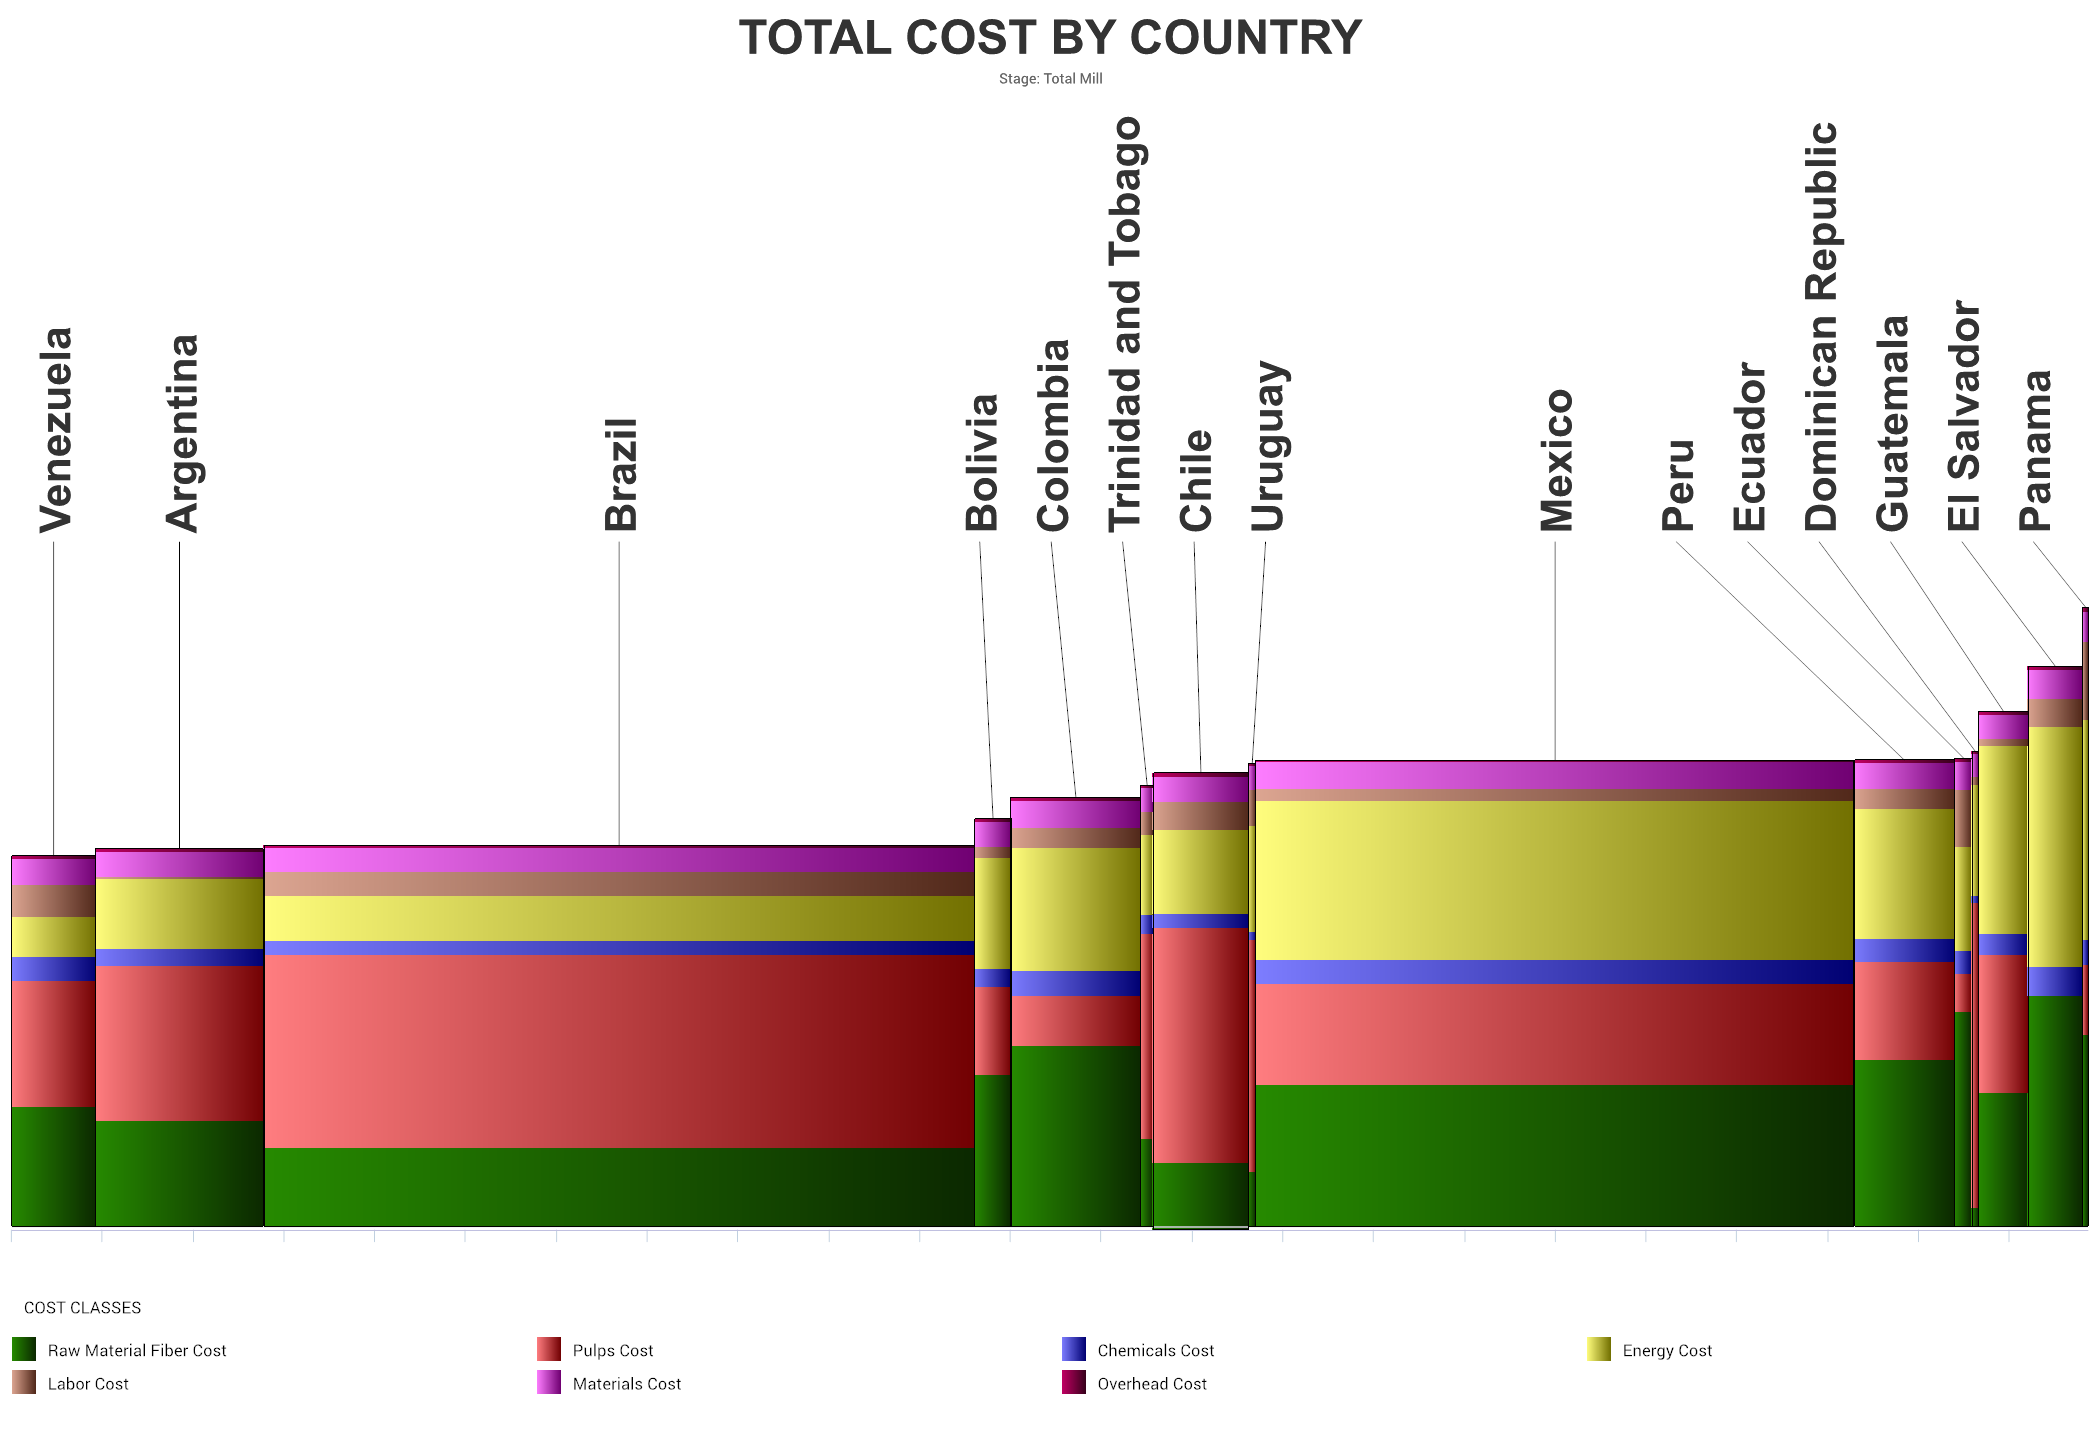
Figure 13 provides valuable insights into the relative average cost of producing a ton of tissue in Latin American countries. To facilitate local comparisons, Brazil was included in this analysis. Each country's bar height represents the cash cost of production, while the width of the bar signifies the relative tissue capacity. The colorful bands on each bar depict the various costs involved, including raw fiber material, market pulp, chemicals, energy, labor, materials, overhead, and credits.
Figure 13: Average Cost of Tissue Production

Source: FisherSolve
While Venezuela and Argentina boast the lowest cost set, their extremely high inflation rates can complicate direct cost comparisons at any given moment. On the other hand, Mexico faces relatively higher energy costs compared to most of Latin America. These costs are averages, and individual machine costs can vary significantly.
Figure 14 provides an overview of the average viability of tissue machines and mills. The bar height represents the cost, and other factors such as capital required, grade risk, competitiveness, size, technical age, and tons per unit trim are also considered.
Figure 14: Average Viability of Tissue Machines and Mills

Source: FisherSolve
Most countries do well in this comparison, positioned at the lower end of this set. However, El Salvador, Venezuela, Uruguay, the Dominican Republic, Ecuador, and Panama are in the high-risk group with lower viability.
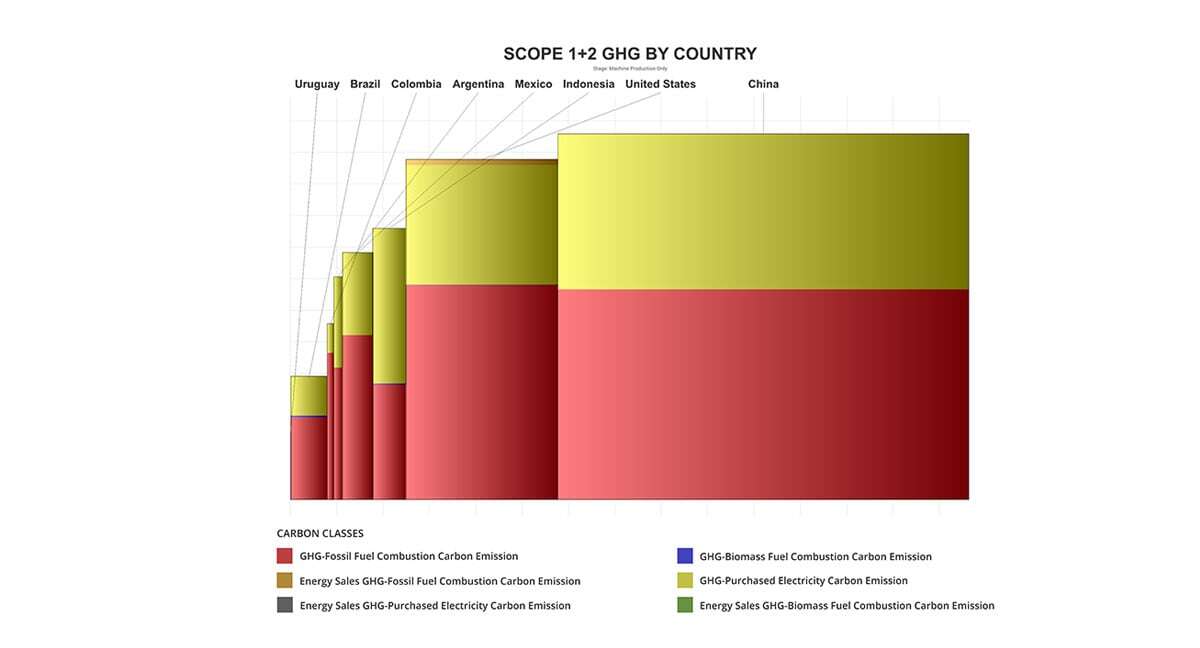
Figure 15 displays carbon emissions per finished metric ton, specifically focusing on emissions from tissue machines on-site and excluding pulp production at integrated sites.
Figure 15: Tissue Production Carbon Benchmark

Source: FisherSolve
Scope 1 and 2 emissions were chosen as they are most likely to be included in a carbon analysis by potential consumers. The colors stacked in each bar represent the source of each emission. The two key areas are fossil fuel consumption on-site for power and heat during tissue drying, as well as the fossil fuel content of electricity grid production.
In terms of carbon emissions, Uruguay and Brazil are leading the way, demonstrating the most favorable results on the chart. On the other hand, Trinidad and Tobago, Panama, and the Dominican Republic are not faring as well in this aspect. It's important to note that carbon emissions are influenced not only by the type of electric grid power or mill heat source, which can range from coal to natural gas but also by the energy efficiency of each machine in producing the same amount of tissue.
To Recap...
Latin America maintains a relatively balanced trade position, with most imports and exports occurring within the region or with North America. Notably, there is a rising trend in imports from Asia.
While the installation of new machines and technology is underway, the removal of old machines seems to be occurring at a lower rate. The diverse economic and political disruptions specific to several countries pose challenges in comparing costs and hinder the development of regional tissue markets and increased consumer demand.
Analysis of competitive position requires specifics on tissue producers and individual machines. This article presents a static summary of Latin America’s tissue industry today. The region’s tissue mills will continue to change hands and consolidate, and neighboring countries may invest in tissue-making capacity, affecting Latin America’s imports and exports.
Download a copy of our 2022 Global Tissue Industry Study Report

Curious about what else FisherSolve has to offer? Learn more.

What the UCO Market Reveals About Crude Tall Oil Demand

What's Next for Asia's Largest Wood Pellet Supplier?
Decarbonization Opportunities and Challenges in the Tissue and Towel Industry
In today's ever-evolving world, businesses must stay up to date with the latest industry trends and regulations. One area that has garnered...
From Importer to Exporter: An Overview of Brazil's Tissue Industry
Portuguese-speaking Brazil managed to avoid the fragmentation experienced by the Spanish-speaking countries of Latin America during the colonial...
An In-Depth Exploration of the UK's Tissue Sector
Since the Industrial Revolution, the United Kingdom has been a hub of global trade and innovation. This legacy has been carried over into the modern...