 Matt Elhardt
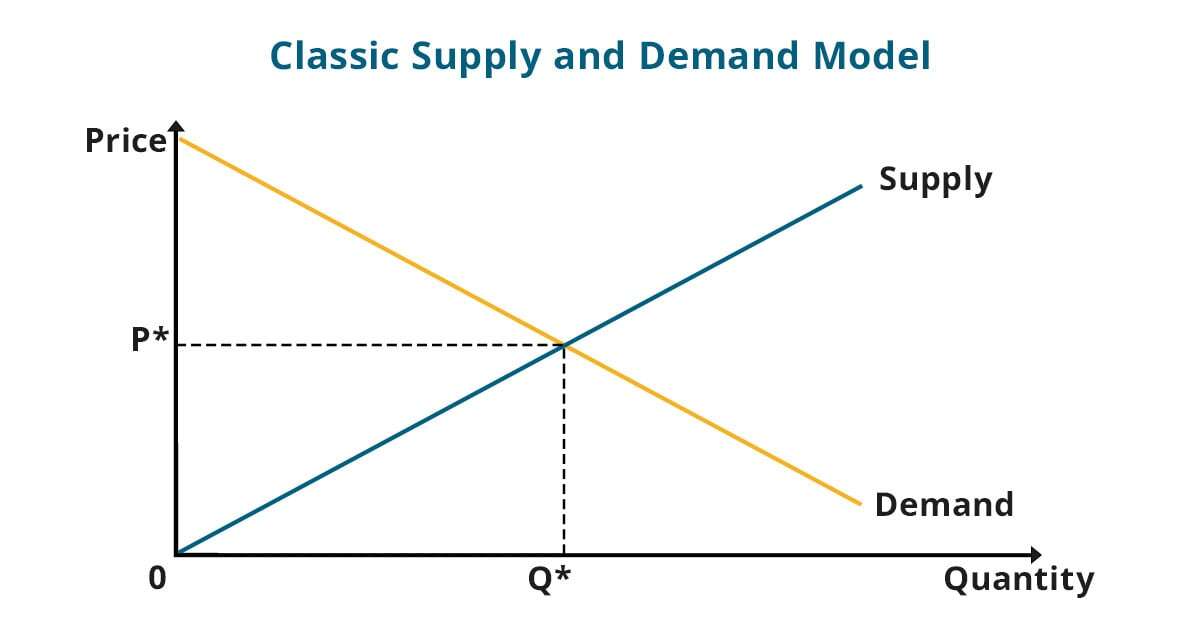
Economic fundamental principles assert that prices are determined by the point at which supply and demand intersect. This theory suggests that by understanding the demand curve (the number of goods consumers are willing to purchase at a specific price) and the supply curve (the quantity of goods suppliers are willing to sell at a specific price), one can determine the price. Technically, at this point, the supply and demand are said to be in equilibrium, as illustrated in Figure 1.
This theory suggests that the point of intersection is reached when buyers and sellers bargain the price downwards (or elevate the price) to match the cost level of the marginal producers. The plain logic is that marginal (or high-cost) producers would rather walk away from an order than sell below cost, which causes buyers to accept the higher price to fulfill demand. Conversely, if demand falls (the demand curve shifts left) the market settles on a lower price.
Figure 1: The Classic Supply and Demand Model

The Dynamics of Price Movements in the Pulp and Paper Industry
In the pulp and paper industry, the supply side is well-understood through the analysis of cost curves. FisherSolve can create cost curves for various market factors like location, product, materials, and machine type. These factors are drawn from our platform’s extensive and integrated database, providing a comprehensive understanding of the supply side. Figure 2 highlights where the demand line and supply line intersect, representing the cost curve.
Figure 2: The Supply Cost Curve

While it’s possible to precisely define supply and its marginal cost for every market segment, alone it cannot fully explain complex price movements. This is especially true in the short run when most buying and selling occurs.
The supply and demand theory, known as “econometrics,” is often used by analysts in the pulp and paper industry to forecast prices. While some forecasters rely on mean reversion and a constant margin, this approach fails to acknowledge the unpredictable nature of prices in this industry, which often deviate from expected patterns and rarely behave uniformly.
A simplistic price behavior analysis often leads to poor business decisions with potential negative consequences. For instance, One might believe that by closing down more mid-cost mills in one’s fleet instead of higher-cost mills, one can manipulate the supply curve to their favor.
A well-known industry consultant circulated this idea about 10 years ago. It may appear plausible if we assume the credibility of the econometric supply-demand theory and assume that individual mills within a company do not share aligned go-to-market strategies. However, it becomes evident that such a decision could lead to substantial losses of market share, competitiveness, and profitability.
How can we determine the lack of reliability in applying the supply-demand theory to the pulp and paper industry? If prices were truly determined solely by marginal producers’ cost levels all of the time, market prices would consistently follow those levels. When costs increase, prices would rise accordingly, and when the costs of marginal producers decrease, prices would fall in response. However, historical data has proven that this is not the case.
It's important to note that there are instances when costs do influence prices, particularly when prices fall below the marginal cost of production – also known as the price floor. During these periods, the impact of marginal costs becomes evident. Rising costs may lead to an increase in prices, while negative margins can force mills out of the market. This can consequently alter the supply and demand balance while also pushing prices up.
This was seen during the global pandemic when extraordinarily high freight rates drove up the global costs of kraft linerboard, leading to a significant imbalance. The repercussions of this can be observed in Figure 3, which was presented during a webinar to the International Corrugated Case Association.
Figure 3: KLB Delivered Costs 4Q2019 and 2Q2021 by Major Port

The image illustrates the disruptions caused by the asymmetries in factor costs within the global containerboard sector. Many mills we spoke to had misinterpreted the sudden lack of competitiveness for increased demand.
Why Does the Supply-Demand Theory Fall Short in Predicting Prices?
In the complex world of supply and demand, pricing decisions are not always driven solely by the cost of production. Buyers and sellers engage in negotiations that are influenced by a variety of factors, including strategies that may be different from those of competitors or other buyers. For instance, some producers may be willing to operate at a loss for a certain period, which can have a ripple effect on pricing dynamics.
Pricing decisions made at the negotiating table are also influenced by various factors, including shifts in lead times, concerns about potential shortages, buyers stockpiling goods in anticipation of price hikes, and other psychological factors. These ultimately contribute to price fluctuations that may not align with the predictions of a traditional supply-demand analysis.
Forestat Global's lumber price history can be seen in Figure 4. This demonstrates the unprecedented run U.S. lumber prices experienced during the COVID-19 pandemic. Prices moved dramatically higher than the marginal cost of production, which is closer to an index value of 100 on this chart. It's likely buyer speculation regarding availability drove the price action.
Figure 4: Converted Wood - Lumber SW Price Indices

Buyers and sellers determine prices based on their assessment of each other’s strategies, bargaining power, and likelihood of achieving their desired outcomes. The dynamics of the "free market", also known as market forces, are significantly shaped by the evolving conditions of the present market and the participants' predictions. Some of the market forces buyers and sellers tend to speculate on when considering prices include:
- Operating rates
- Inventories
- Costs
- End-demand
- Capacity changes
- Order backlogs
- Shipments
Industry participants utilize every available piece of information at their disposal to strategically position themselves in the market — creating a bit of a “mental chess game.”
Forecasting Prices and Their Turning Points Is Hard, Unless…
In an ideal scenario, the logical econometric model would be sufficient. However, in the realm of real transactions and market dynamics, accurately predicting price behavior necessitates the capacity to simulate how the market behaves.
This means you would have to:
- Understand and analyze people’s current and future speculations about the future.
- Examine how these speculations will influence the actions and decisions of buyers and sellers.
- Determine how these behaviors will shape their future predictions and subsequent responses, creating a chain reaction.
At ResourceWise, we utilize System Dynamics mathematics. Developed jointly with our partner STE Analytics, this tool simulates the evolution of markets, including price and margins and all of the factors that have historically driven price movement.
Simulation is a powerful tool that can provide a more accurate and reliable prediction of prices and turning points in the market. By utilizing simulation, we can gain insights into when these turning points will occur, understand the underlying reasons behind the market's behavior, and anticipate the outcomes of significant events and actions taken by participants.
Simulation also enables the testing of scenarios and defining the probability of market outcomes. Figure 5 illustrates different simulations showing the likely range of price outcomes based on statistical confidence.
Figure 5: Simulated Scenarios

System Dynamics mathematics coupled with ResourceWise's innovative business intelligence platform FisherSolve, you have access to a wide range of data that enables you to contextualize forecasts within the competitive environment, fostering strategic development. This invaluable tool allows you to delve deep into the specifics, empowering you to make well-informed decisions and secure a competitive edge in your industry.
This includes data on all the following areas and more:
- Assets
- Production
- Operations
- Environmental flows
- Costs-of-production
- Long-term viability
- Carbon footprint
Contact us today to learn how our experts can unlock your organization's full potential and help you thrive in a volatile market.


What the UCO Market Reveals About Crude Tall Oil Demand

What's Next for Asia's Largest Wood Pellet Supplier?

Energy Shocks Don't Just Raise Costs—They Reshape Markets
When natural gas prices spike, most market participants ask a familiar question: How much will costs go up?
Wood Chip Supplies Diminish and Prices Soar in the Pacific Northwest
Labor union strikes and industry developments that have pinched the supply of conifer wood chips in the Pacific Northwest (PNW) now have a number of...

China's Paper Industry Faces Price Increases Amid Rising Costs
China's pulp and paper industry is facing challenges as major producers announce price hikes for early 2025. Starting in February and March, several...