
 Amy Chu
A Brief Snapshot of the Global Paper Industry
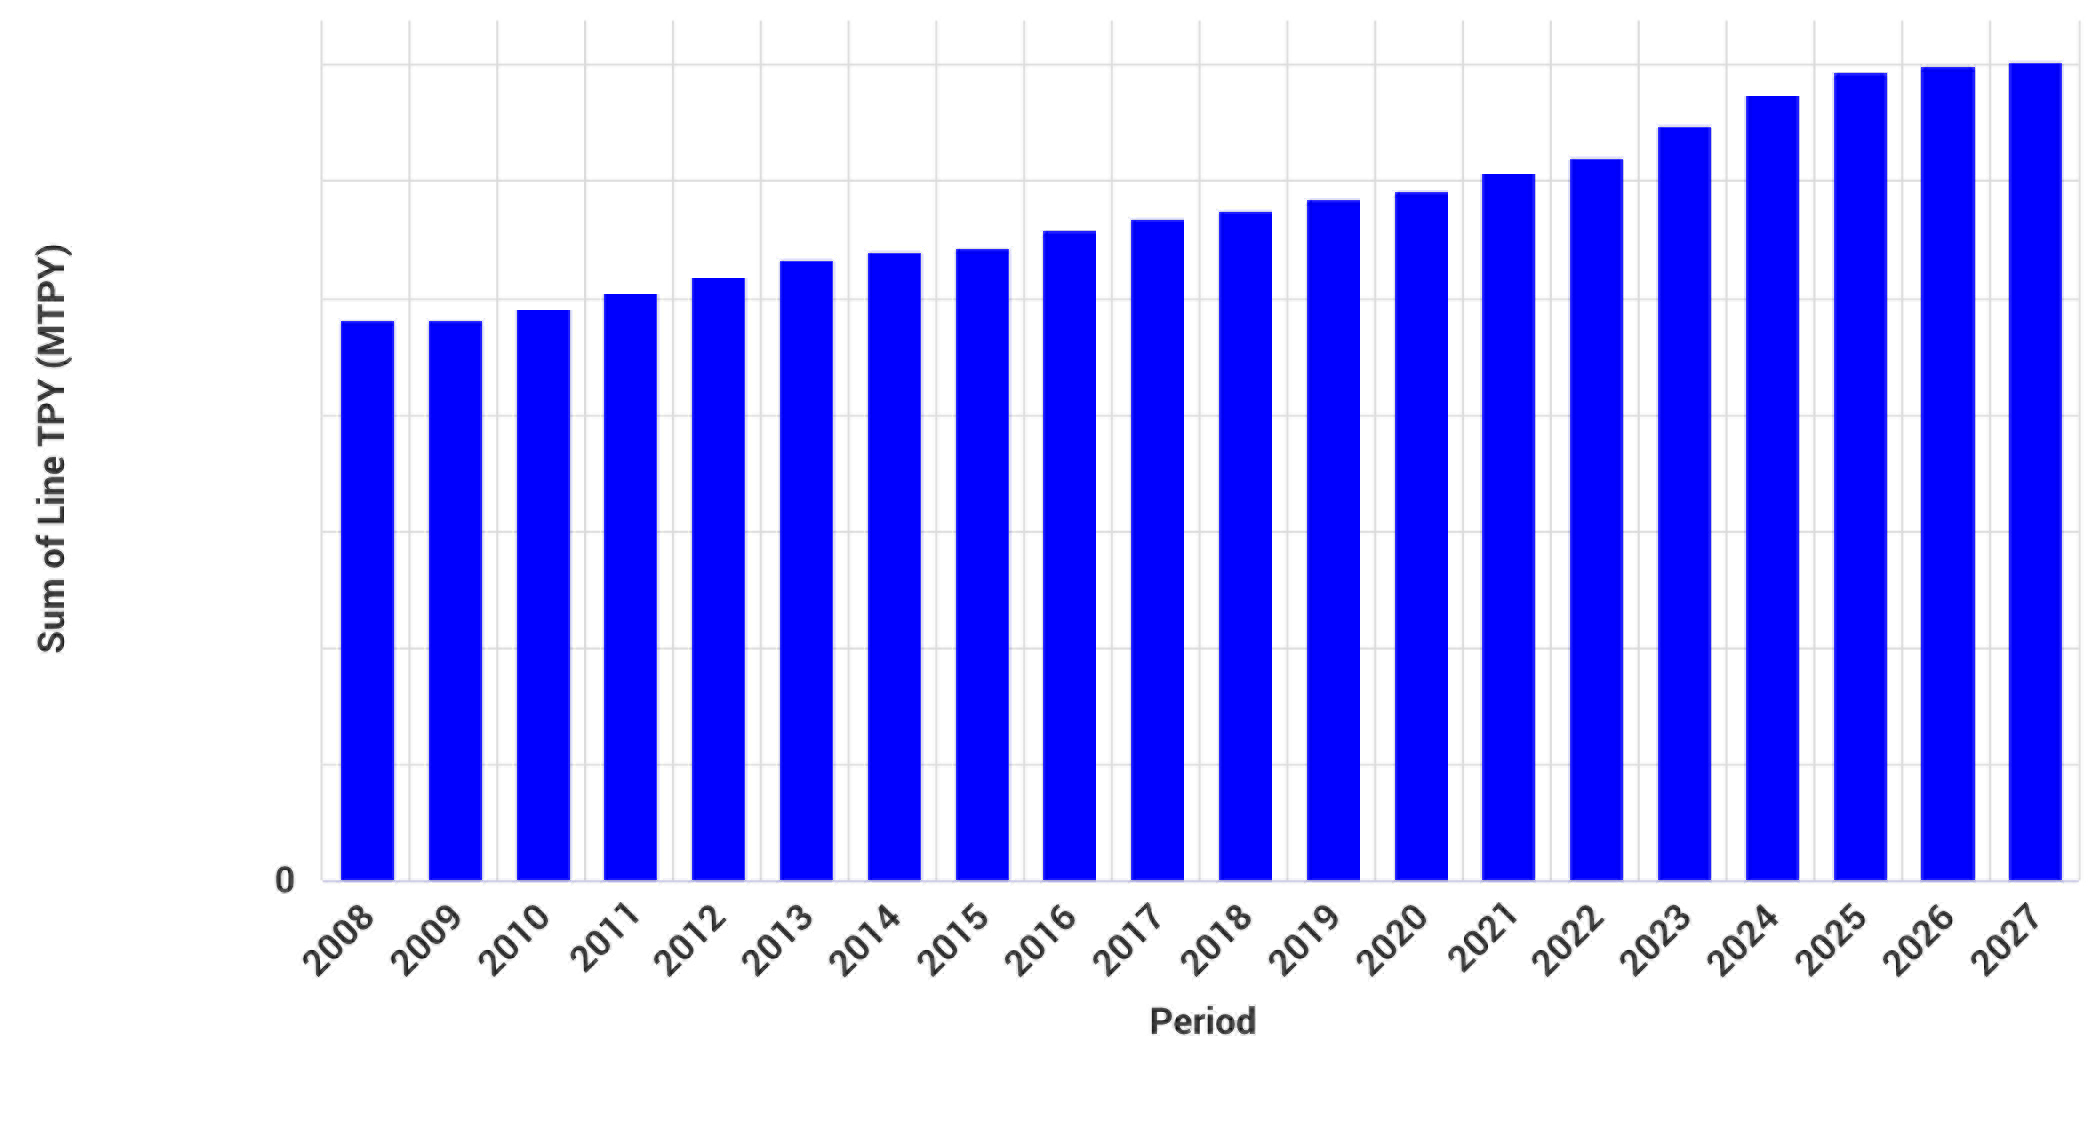
The global pulp and paper industry continues to thrive, with a strong focus on the packaging sector and tissue and towel sector. The industry is expected to experience a compounded annual growth rate (CAGR) of approximately 2%. Looking ahead, we expect to witness the addition of around 70 million tons of new capacity by 2027, thanks to various ongoing and upcoming projects.
Actual and Announced Global Pulp and Paper Capacity 2008-2027

Source: FisherSolve
For a deeper look at the performance of certain major grades in 2023, read our blog:
“2023 INSIGHTS ON MAJOR GRADES OF THE PULP AND PAPER INDUSTRY”
Wood Consumption in Pulp and Paper
Wood consumption in the global pulp and paper industry is estimated to be around 400 million tons annually. The majority of this consumption, roughly 80%, is attributed to the top 10 papermaking countries.
Among them, the United States leads the pack in terms of wood fiber consumption, followed closely by Brazil. China ranks third as a major consumer of wood raw materials for papermaking, with an expected consumption of approximately 34 million tons this year.
Different countries exhibit significant variations in the usage of long and short fibers. While North America and Europe tend to favor long fibers, Asian and Latin American countries lean towards short fibers. This preference is largely driven by the availability of local forest resources.
Global Wood Consumption in the Pulp and Paper Industry

Source: FisherSolve
Over the past few years, there have been significant changes in China’s papermaking industry due to the implementation of bans and restrictions on plastic, as well as the introduction of scrapping orders. This has led to a shift in the raw materials used for paper production, with a growing demand for wood pulp.
China, a major importer of commercial pulp, is now witnessing a rise in investments in pulp lines by various companies. These investments aim to reduce the country's reliance on imported pulp and gain all the revenue from the value chain. ResourceWise has noticed that the newly installed pulp line capacity in China reached new records in 2022, and this trend seems to be continuing.
Global Forest Resource Distribution
Forests are vital in sustaining life for over a billion people, providing essential resources such as food, medicine, and biofuels. They are not only crucial for biodiversity conservation and the preservation of soil and water but also serve as a powerful tool in combating climate change. Their significance cannot be overstated.
Comprising one-third of the Earth’s land area, forests span a vast 4.06 billion hectares. However, their distribution is far from uniform geographically and among different populations. Tropical regions boast the highest proportion of forests globally, accounting for a staggering 45%. Following closely are the boreal, temperate, and subtropical regions.
When it comes to the countries with the largest forest areas, Russia, Brazil, Canada, the United States, and China take the lead. Collectively, they cover more than half (54%) of the world’s forested land, which amounts to over 2 billion hectares.
Forests Distributed by Country

Source: Global Forest Resource Assessment
Forests consist of naturally regenerated and plantation forests, with bamboo forests in Asia, particularly China and India. Forest management objectives include wood and non-timber forest product production, soil and water conservation, biodiversity preservation, and social services like recreation and research. Approximately 30% of global forests are primarily used for wood and non-timber forest product production.
Over the past 30 years, the world’s forest area has experienced a decline of around 170 million hectares. However, this decline has slowed due to reduced deforestation in some countries, afforestation efforts in other regions, and the natural expansion of forests. Asian and European forest areas have increased, while Africa and South America have seen significant losses.
Changes in Total Forest Area by Region

Source: Global Forest Resource Assessment
The area of naturally regenerated forests remains largely unchanged in different regions. In Africa and South America, 98% of forests are naturally regenerated. In Europe, North America, and Oceania, it is 95%. Asia has 78% naturally regenerated forests, reflecting afforestation efforts, especially in China. However, the area of naturally regenerated forest has decreased in all regions except Europe and Oceania, with the largest losses seen in sub-Saharan Africa and Brazil.
When looking at the changes in planted forests in different regions, Asia has the largest planted forest area. They are followed by Europe and North America. However, not all plantations are used for industrial production.
South America has the highest proportion of industrial plantations, while Oceania has the highest proportion of planted forests. In Asia, 60% of planted forests are artificially planted.
Trends in the Growth of Planted Forest Areas by Country

Source: Global Forest Resource Assessment
Data from the China Forestry and Grassland Statistical Yearbook shows the growth of industrial plantations in the top ten papermaking countries. Brazil, Indonesia, and Chile have large pulping production capacities and rely solely on industrial plantations for wood fiber. China and the United States have more than half of their forest area as industrial plantations, while other countries like Russia, Canada, and Sweden have a mix of different types of plantations.
In 2022, China’s forest area reached 220 million hectares, accounting for 5% of the world’s forest area. The national average forest coverage rate is 23%, with regional variations. Fujian province has the highest coverage at 66.8%, while provinces like Xinjiang and Qinghai have less than 5% coverage.
China’s Forest Coverage by City

Source: China Forestry and Grassland Statistical Yearbook
China’s forests are mainly categorized into arbor, bamboo, and shrub forests. Arbor forests dominate the landscape, while bamboo forests cover 6.4 million hectares nationwide. Fujian has the largest bamboo forest area at 1.14 million hectares, followed by Jiangxi and Hunan, making up 45% of China’s bamboo forest area.
Wood Chip Supply and Price Trends
Let’s examine wood prices worldwide, including hardwood and softwood logs and wood chips. Hardwood prices are lowest in the Americas (Brazil, Chile, United States, Canada), while Europe and Asia experience relatively higher prices. Softwood price trends are similar.
Supply and demand affect prices, with Brazil and Chile having 100% industrial plantation forests, North America having over 50%, and Europe mainly consisting of ordinary industrial forests. Japan and China rely on imports, resulting in higher prices.
ResourceWise’s WoodMarket Prices, which provides softwood and hardwood pricing data, has remained relatively stable at $80–100 USD for the past 20 years. However, starting in 2021, there has been a significant increase in prices, particularly for hardwood. Global hardwood prices reached over $110 USD last quarter, reaching a historical high and impacting the profits of pulp mills. This trend has also contributed to the continued rise in pulp prices.
Global Timber Price Index

Source: WoodMarket Prices
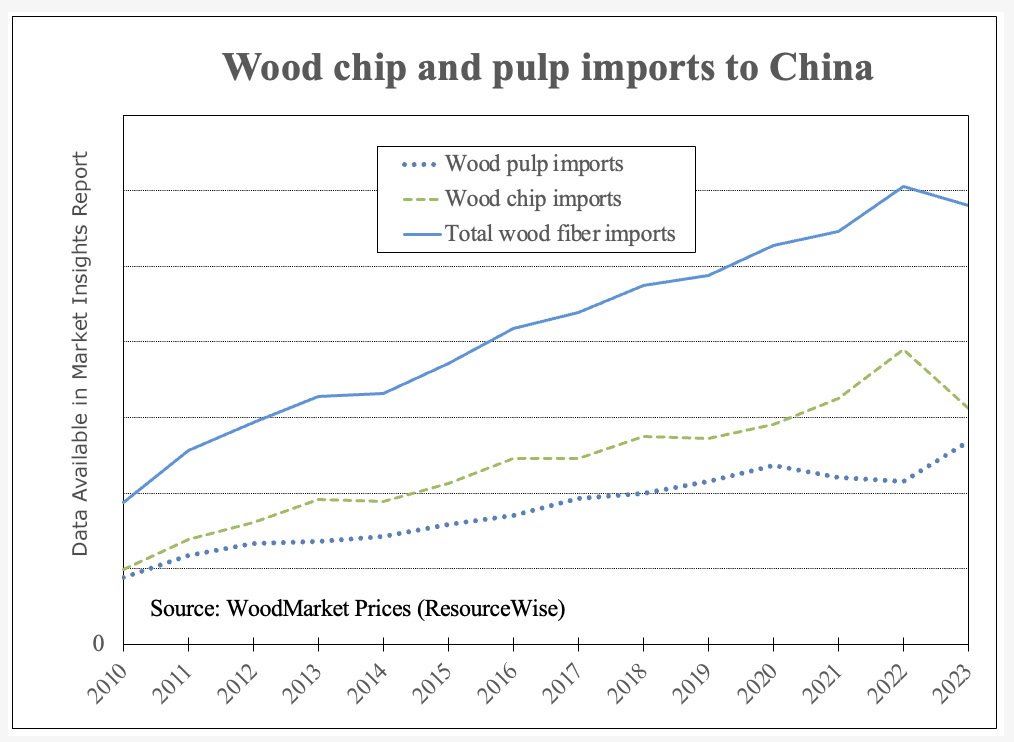
Since 2011, China’s import volume of hardwood chips has been steadily increasing, driven by the continuous growth of the papermaking industry. In 2011, the import volume was 6.2 million tons, which nearly tripled by 2022. Notably, there was no decrease in import volume even during the pandemic. In 2020, the import volume was 13 million tons, and it approached 15 million tons in 2021, showing significant growth.
Vietnam is China’s leading supplier of hardwood chips, accounting for 60% of imports in the Chinese market. Australia is the second largest source, with its market share reaching its peak in 2017. China recently lifted its ban on Australian timber, so the share of Australian wood chips may gradually increase. As for softwood, the United States, Australia, and Russia are the main sources of imports.
The image below illustrates the price trajectory of wood chips from various hardwood chip source countries imported into China.
Price Trend of China’s Imported Hardwood Chips

Source: WoodMarket Prices
The cost of wood chips from Vietnam and Thailand is lower than those from Australia and Chile. However, the superior quality of Australian wood chips makes them the preferred choice for domestic companies.
These companies utilize Australian wood chips to produce high-end pulp varieties like dissolving pulp and fluff pulp. As the volume of wood chips imported into China continues to surge, it has brought about changes in the price and supply dynamics of wood chips in the Asian market.
For further in-depth analysis and expertise, reach out to ResourceWise today. We are here to provide you with valuable insights and solutions tailored to your specific needs.

DOE’s Updated 45Z GREET Model Brings Clarity to US Biofuels Markets

EUDR Compliance in 2026: Why Traceability Has Become a Competitive Advantage
A Look at China's Fiber Import Trends
China's paper industry heavily depends on a combination of local and imported pulp and wood chips to fulfill its fiber requirements. The balance...
Understanding China's Woodchip Import Patterns
In the past 10-15 years, there has been an exponential rise in China’s demand for woodchips. The main driver for this was an investment boom in pulp...
Nordic Forest Products Sector Under Pressure from High Wood Costs and European Environmental Regulations
Forest products professionals in the Nordic region are being squeezed by high raw material costs and evolving environmental regulations that have...