
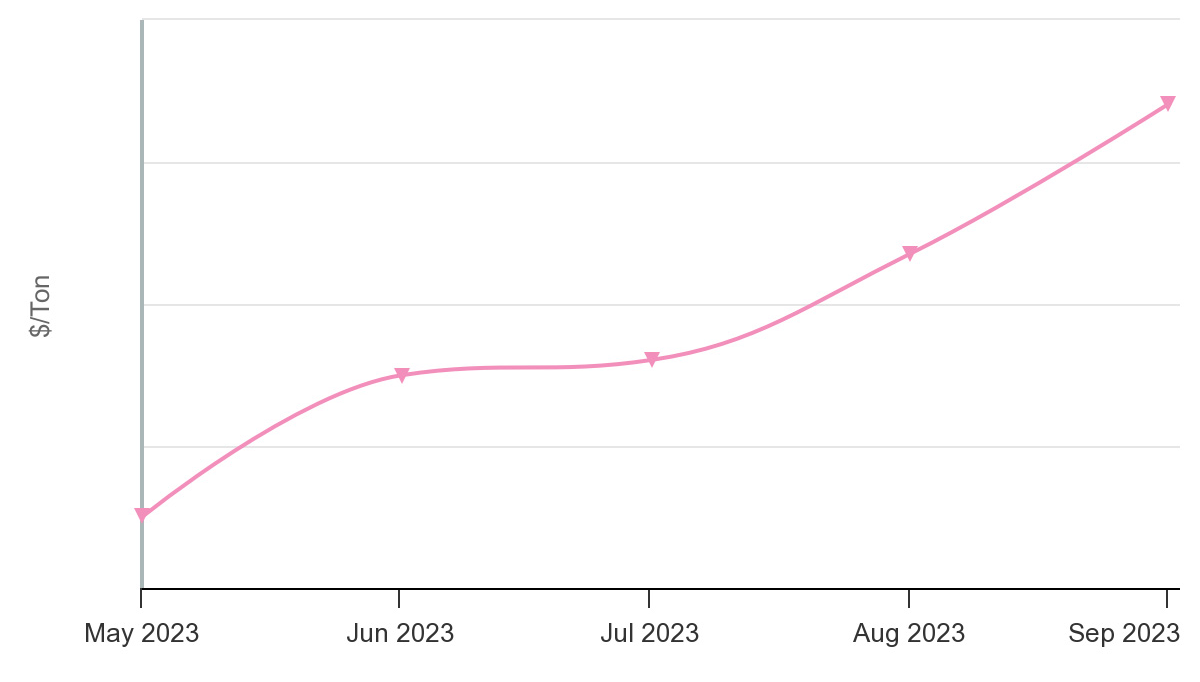
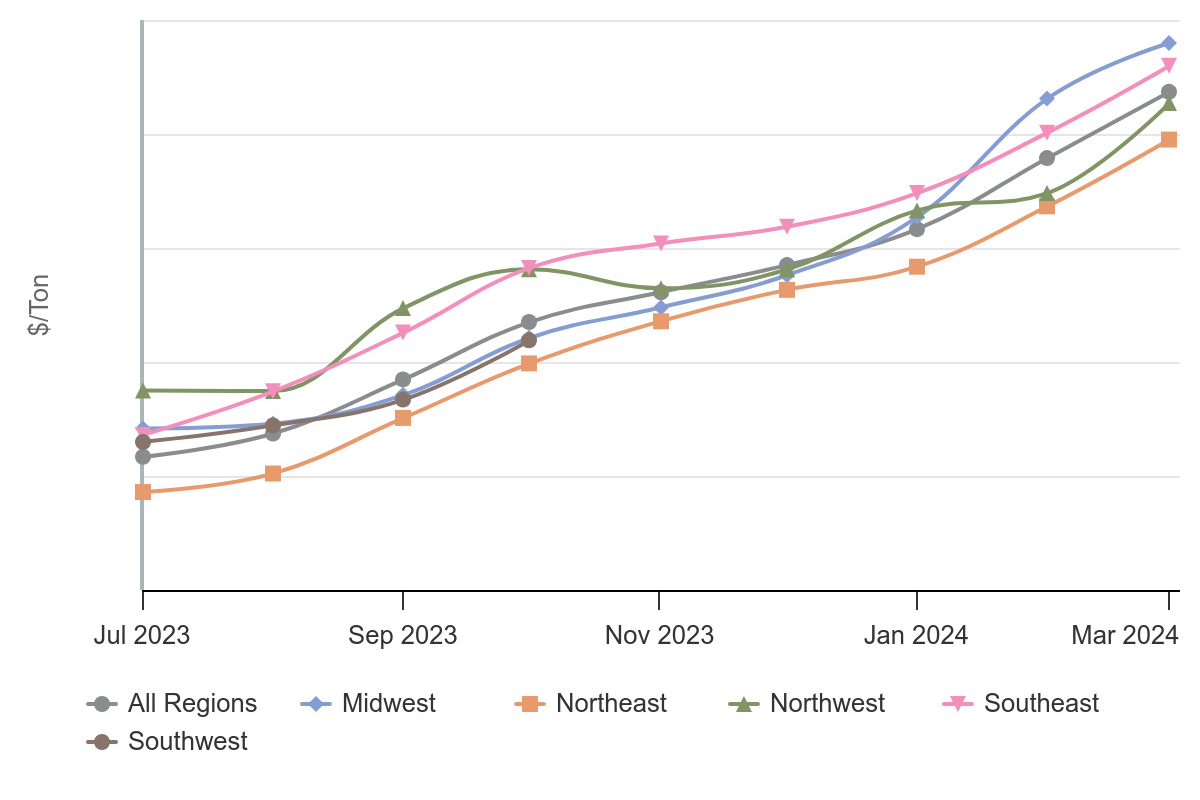
During the latter half of the year, the prices of recycled fiber in the US Southeast region witnessed a noticeable increase. Within just four months, prices escalated by almost $30/ton. Although other regions also followed a similar trend, with prices peaking in September, the Southeast experienced some of the highest prices second only to the Northwest.
US Southeast Recycled Fiber Prices

Source: Recycled Fiber 360
In this blog post we’re going to look at:
- The difference of monthly fluctuations in contract prices versus spot prices
- The impact of this disparity on users who rely on survey-based indices for pricing information
- The difference between survey-based indices versus transaction-based indices
Examining the Fluctuations in Contract Prices versus Spot Prices in Recent Months
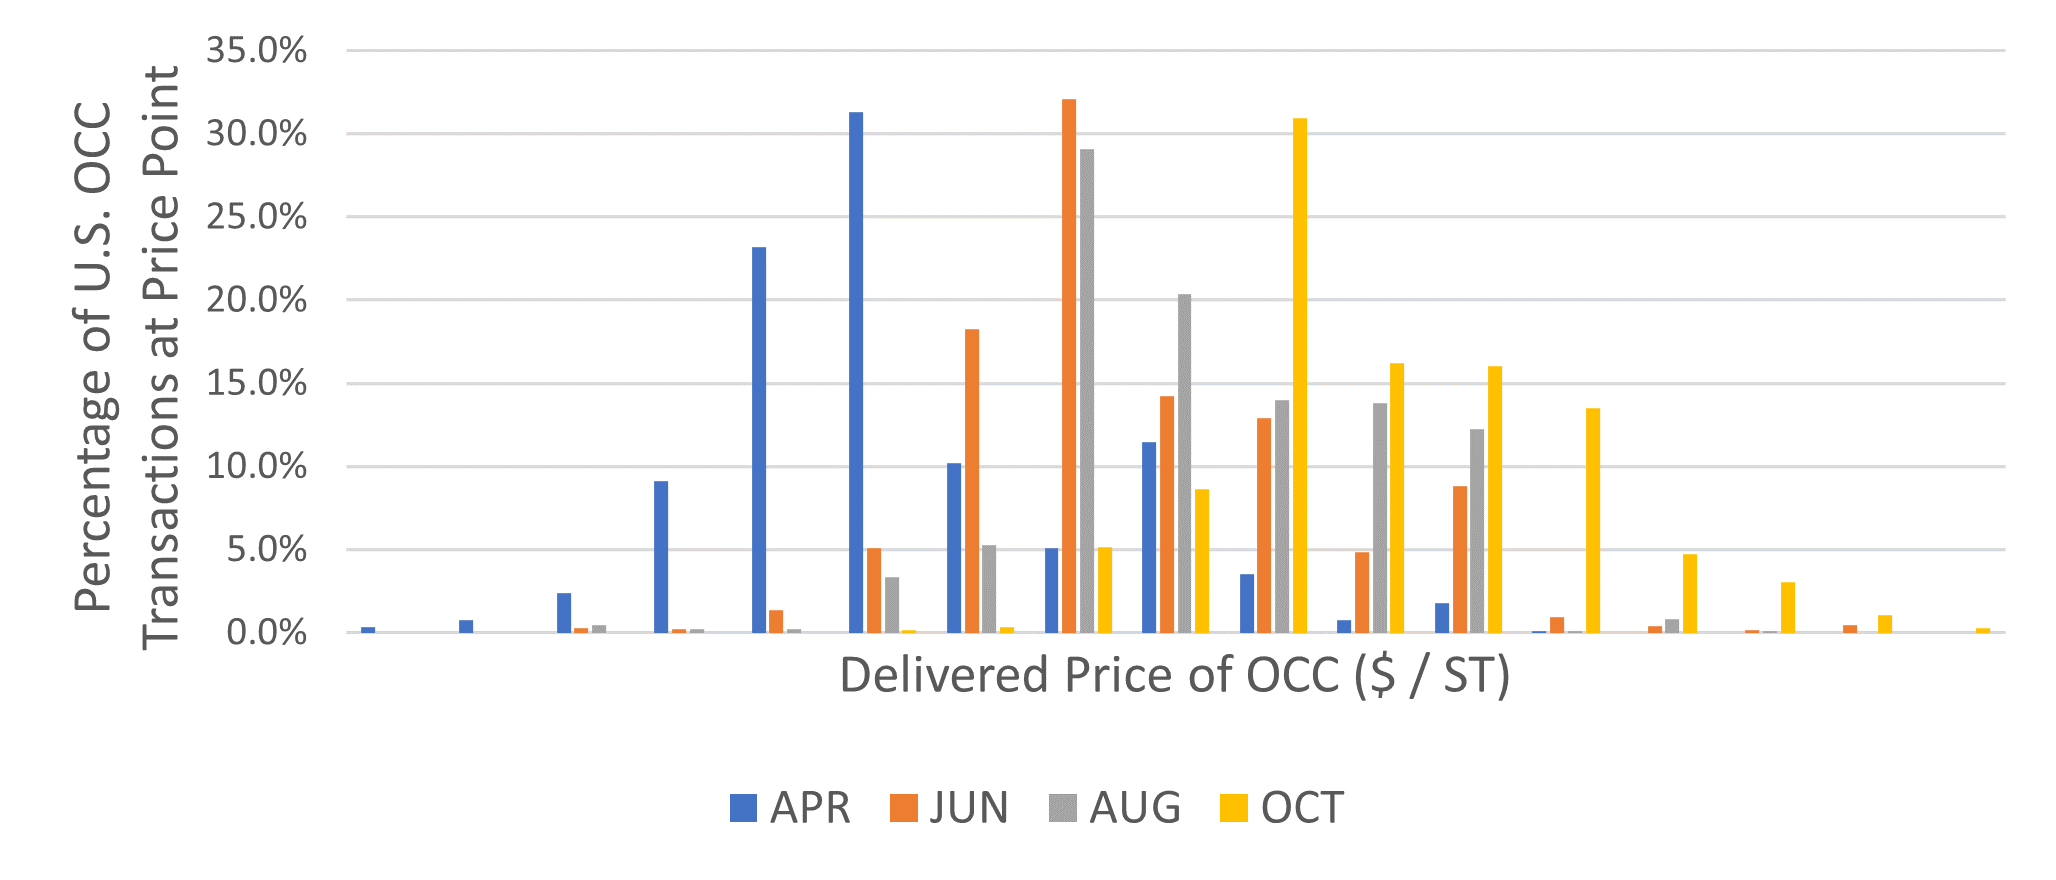
Since Recycled Fiber 360 uses actual transaction data, we can utilize our proprietary model to segment prices into spot (that is, not adjusting simply off an index) versus contract. When we do this for the Southeast, we can easily see the difference between the two, revealing the stark contrast between the growth rate of spot prices and contract prices.
During the period of June-August, contract fiber costs in the Southeast rose at a higher rate than spot. Literally, this means that the widely used pricing report over estimated price movement during this time. August experienced the most significant increase with contract prices increasing 10% compared to the 5.6% increase in spot prices.
US Southeast Recycled Fiber Prices: Spot vs Contract

Source: Recycled Fiber 360
This trend has significant implications for participants in the recycled fiber market. Mills that rely solely on adjusting their prices based on an index run the risk of paying significantly more than they would have if they had purchased on the spot market.
Moreover, these differences create friction between buyers and sellers, as each side of the trade may feel like they are not getting a fair deal. In the North American OCC markets, this often leads to participants debating over "premiums" or "discounts" to account for the inaccuracies of market indices.
Survey-Based Data vs Transaction-Based Data
The market for OCC and recycled fiber is an incredibly volatile one. Prices and trends are constantly in flux and rarely maintain a consistent pattern. This can often feel overwhelming and challenging to navigate. However, by utilizing the right data, you can effectively stay ahead of the game and secure the fiber you require at the best rate.
When searching for the perfect data platform to provide you with this crucial information, there is one key factor you should prioritize: transaction-based data.
Although qualitative research and survey-based methods can provide some insight into price trends, they often lack the systematic and reliable data necessary for accurate analysis. Surveys can be subjective and introduce biases, turning it into more of a conversation rather than formal data reporting.
Transaction-based data, however, offers a more precise and reliable understanding of market prices. It allows you to analyze actual sales transactions and eliminate any uncertainties or misleading information. As a result, market movements will no longer catch you off guard, and the data will accurately reflect the real experiences you and other businesses are experiencing.
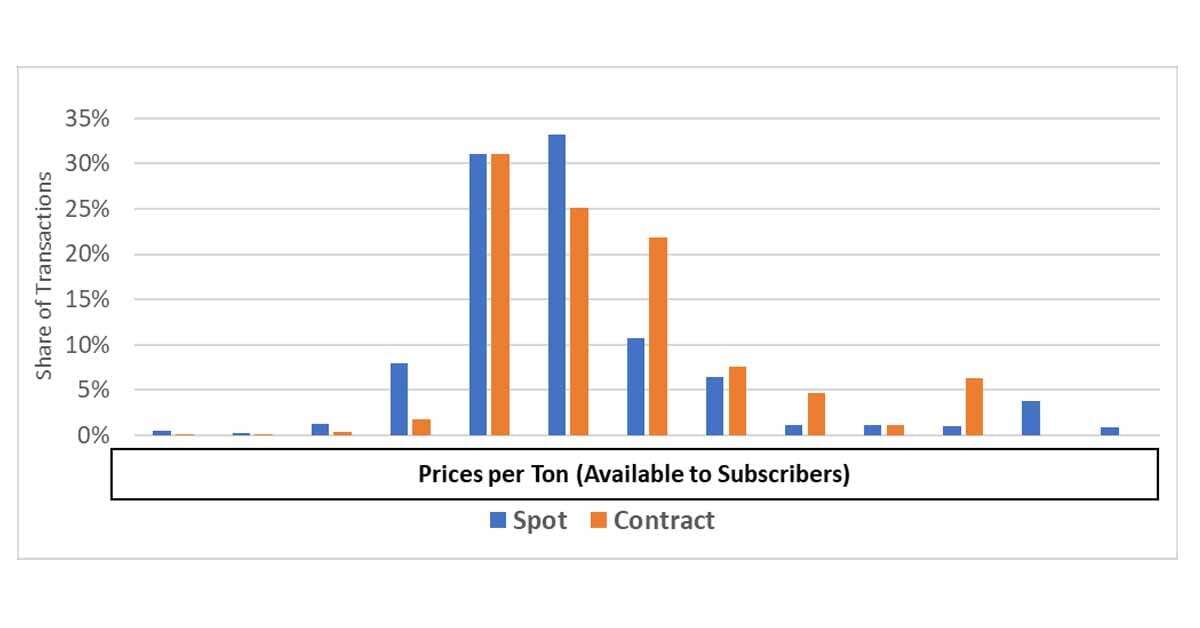
In fact, we've seen a remarkable contrast between the figures provided by a transaction-based benchmark and survey-based benchmarks. As seen in the image below, during 1Q2023, there was a noticeable disparity of slightly over $50 per ton between the prices reported by Recycled Fiber 360, the transaction-based benchmark, and a third-party benchmark. This significant difference raises an important question: which of the two benchmarks is more accurate?

When analyzing the real market prices versus the indexing, Recycled Fiber 360's reported prices were spot-on. And while the third-party benchmark also reflects a similar price pattern, this shows that you could be receiving prices that deviate from the actual market conditions.
Recycled Fiber 360: Providing You with Transaction-Based Data
Using a "give to get" approach, Recycled Fiber 360 provides its users with valuable monthly updates on real transaction data from across North America. This confidential and anonymized data empowers companies to gain a deeper understanding of the competitiveness of their purchasing or sourcing strategies. Armed with this knowledge, businesses can seize opportunities for negotiation, whether it's regarding the base price, transportation, or other factors that influence their operations.
With Recycled Fiber 360, users can:
- Analyze index breakdowns based on regions and products, allowing users to easily access the precise pricing data they require, whether it's delivered or FOB.
- Gain insight into the dynamic market movements over time by tracking the historical price trends and their correlation with industry events.
- Compare contract sales and open market sales for a comprehensive analysis of market dynamics that provides valuable insights into future market trends.
- Analyze the performance of individual mills within a company and compare them to other facilities in the same geographical area that purchase recycled fiber.
If you want to discover the full potential of Recycled Fiber 360 and how it can benefit your company, download our eBook.


OCC Prices Have Increased Rapidly – How Does it Impact Linerboard Competitiveness?
According to our transaction-based benchmark Recycled Fiber 360, spot prices have increased dramatically recently. More importantly, the "last tons"...
Analyzing Recycled Fiber OCC Prices in 1Q2024
Recycled fiber markets are volatile, meaning industry professionals need reliable data to stay ahead of changes.Let’s look at OCC price data from Q1...
US OCC Prices Are Now Lower Than Contract – What Does It Mean?
Over the last several months, an interesting flip has occurred in the OCC market. Prices for OCC bought on the spot market are now lower than those...