
As we’ve discussed in previous posts, when examining any sort of market trend across the pulp and paper supply chain, it’s not only important to keep up with the major players in your backyard and in your unique sector; it’s equally important to maintain awareness of what’s happening in the P&P industry in other markets and countries around the world as well.
For example, Indonesia’s pulp and paper capacity growth experienced a CAGR of 1.83 from 2014-2021 and currently has 115 operating sites. While these numbers don’t necessarily compare to those of China, the United States or India, they still play an impactful role in the interconnected global structure of the P&P industry. As a dynamic market, it’s important to understand the current state of Indonesia’s P&P industry and the factors that are shaping its future.
A Quick Overview
When looking at Indonesia’s capacity trend over the last several years, it’s interesting to note the significant increase in capacity that occurred from 2014-2016 before it began to gradually decrease from 2017-present. In fact, Indonesia is expected to end 2022 with the lowest capacity since 2015. However, according to our data from FisherSolve, production capacity is then expected to redirect its growth in 2023 with an anticipated 8% increase.
Pulp & Paper Capacity in Indonesia (Actual and Announced 2012-2024)
 Source: FisherSolve
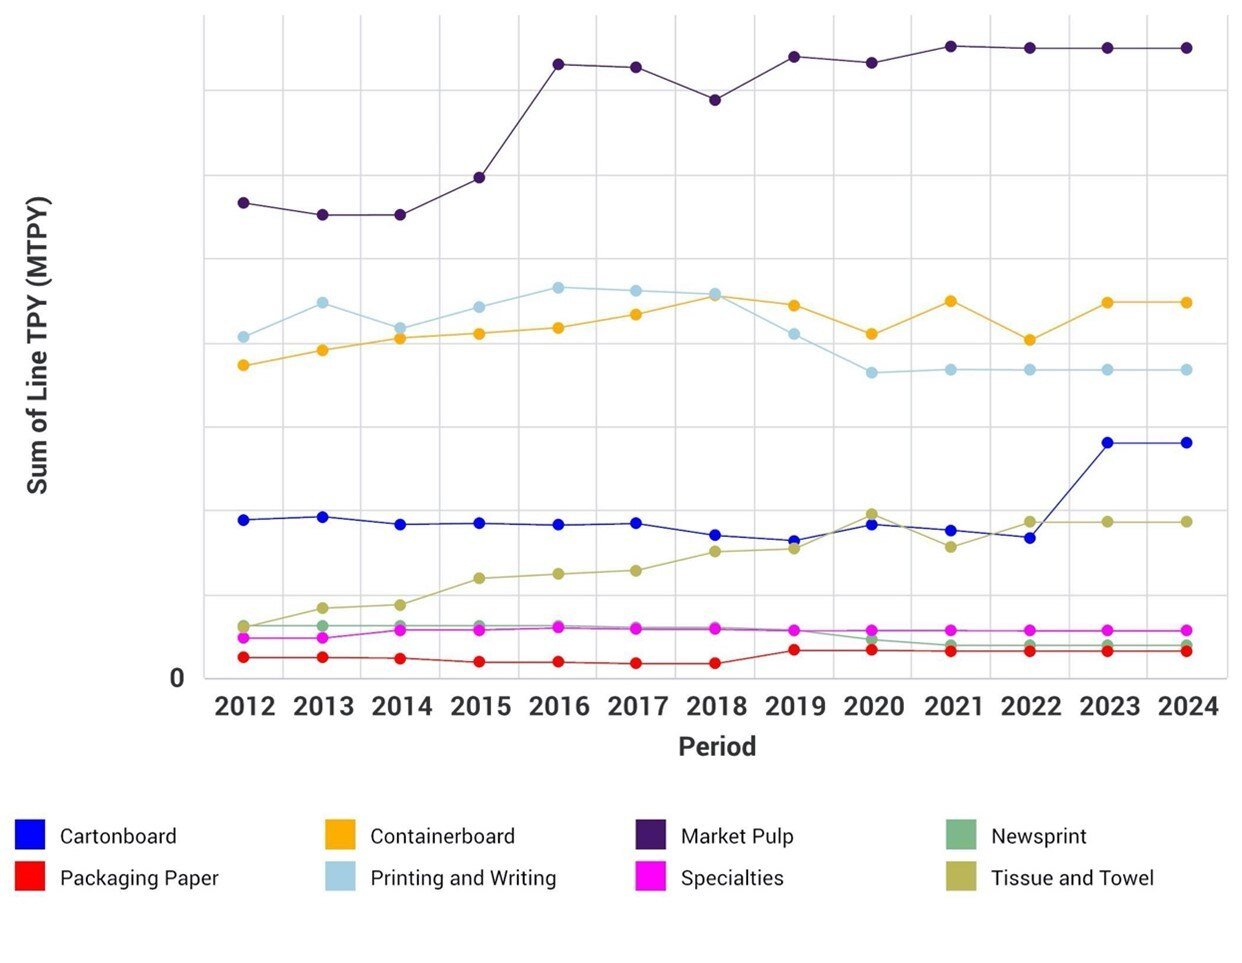
When we break this down by major grades, there is a trend we haven’t typically seen when analyzing major grade capacity in various regions: market pulp is the clear-cut leading grade produced in Indonesia compared to the others. Within the last few years, we are used to seeing containerboard as the leading grade – however, at the end of 2022, there will be an expected 86% difference between market pulp capacity and containerboard capacity in Indonesia.
Similar to 2022, the top three leading grades in 2023 and 2024 in this region will consist of market pulp, containerboard, and printing and writing. Although, cartonboard is expected to see a significant increase in production in 2023, moving closer to the three aforementioned grades – a trend that will be crucial to keep an eye on. Most of the other grades are not expected to move as much over the next two years.
Pulp & Paper Capacity in Indonesia by Major Grade (Actual and Announced 2012-2024)
 Source: FisherSolve
The graph below illustrates a cost breakdown of Indonesia’s P&P industry, and as we can see, raw material fiber (35%), pulps (28%) and energy (17%) make up the top three largest cost components – a similar trend to many other countries.
Cost Breakdown of Indonesia’s P&P Industry

Source: FisherSolve
Factors Impacting Indonesia’s P&P Industry
There are a number of factors influencing Indonesia’s Pulp and Paper industry, but some of the most notable include:
- Indonesia’s position as one of the largest exporters for paper and market pulp creates significant growth potential, pushing its P&P market in an upward trend.
- Indonesian paper producers are well consolidated, meaning that the production economy will be better than its peer countries with fragmented producers, such as India.
- The country’s energy cost is one of the highest contributors to total cost due to high coal & gas prices in Indonesia. Its future fuel price trend will have a major influence on the overall competitiveness of its P&P industry.
- Since the government is increasing awareness of the importance to preserve the natural environment, there is less room for the expansion of local pulp and paper manufacturing facilities.
- Indonesia has relatively strong tissue demand as the migrant labor force supplements the slow population growth, and consumer income growth will support further tissue demand.
Overall, we believe that the Indonesian market has high potential due to growing domestic demand and global demand for P&P products. For in-depth analysis backed up by real market data, please contact a Fisher professional today.


DOE’s Updated 45Z GREET Model Brings Clarity to US Biofuels Markets

EUDR Compliance in 2026: Why Traceability Has Become a Competitive Advantage

Indonesia Emerges as a Major Player in Tissue Exports Across Southeast Asia
Indonesia's paper industry has seen remarkable growth in the last forty years, driven by new investments primarily focused on communication papers....

European Waste Feedstock Markets Stabilize as Trade Woes Persist
After some recent ups and downs, waste feedstock prices in Europe have begun to stabilize. This comes on the back of a modest recovery in the UCOME...

Global Shifts, Regional Ripples: What’s Moving the Pulp & Paper Industry in Q1 2025?
From inflation and freight disruptions to regulatory overhauls and billion-dollar mergers, the first quarter of 2025 has already proven to be a...