
Trade and exports play a fundamental and intricate role in the global supply chain. It’s one of the key drivers of economic growth, development and the efficient distribution of goods and services.
To thrive in international trade, it is crucial to grasp the complex interplay of various factors. These include the global economic climate, the complexity of supply chains, government policies, the competitive landscape, and consumer demand. Success in this realm necessitates a comprehensive understanding of these dynamics and the ability to adapt to evolving circumstances.
Navigating the fluctuating currents of the pulp and paper industry alongside the dynamics of the export market can present challenges. You need to understand where the direction of the movements is headed along with their implications for your business decisions.
The pulp and paper industry is primarily export-intensive. Comprehensive insights into the export market and their impact on your business are crucial for stakeholders in the industry.
Pulp and Paper’s Position Within the Global Export Market
Data from FisherSolve indicates that at the end of 2022, roughly 30% of the global pulp and paper grades produced were exported and sold into other markets. In fact, earlier this year, IBSWorld stated that the global paper industry is expected to land in the top 10 largest global exporting industries in 2023. Exports for 2023 are expected to be valued at USD$190 billion.
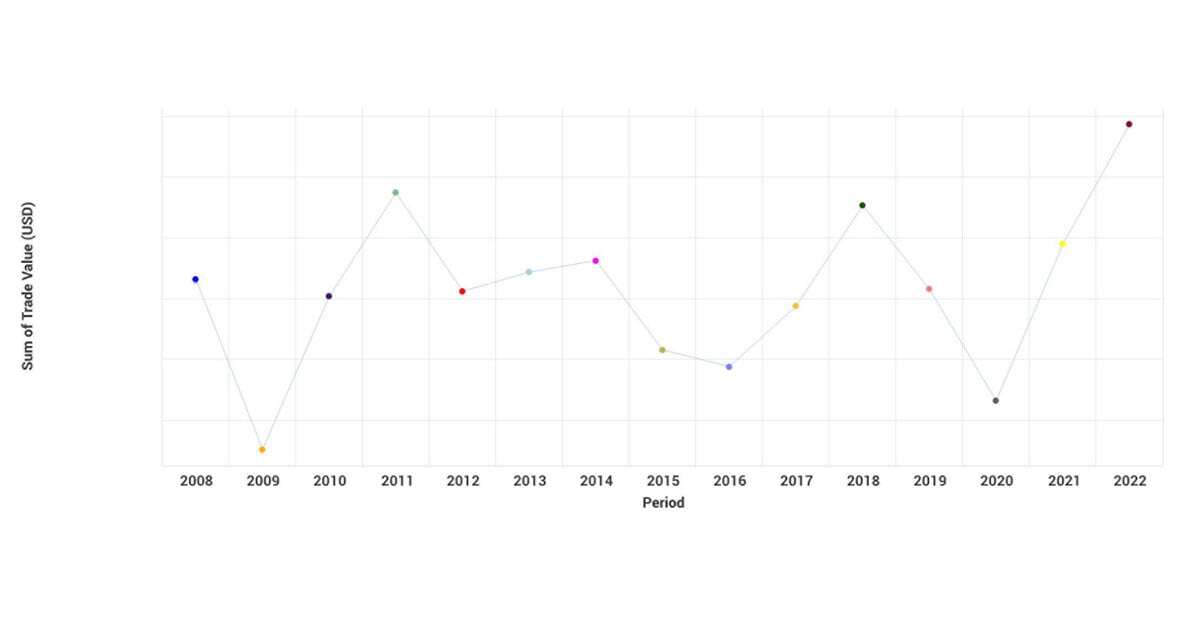
As we can see in Figure 1, the trend for global export trade value in the pulp and paper industry is an incredibly unpredictable trend. Values skyrocket one year then plummet shortly after.
Global Export Trade Value in Pulp and Paper Industry

Source: FisherSolve - Market Trends
For example, the global export trade value in 2021 and 2022 surged after the steep decline experienced in 2020 – the lowest export value seen since 2009.
Although there was a 19% increase in value for 2022 compared to 2020, some burning questions remain:
- What lies ahead for 2023 and the near-term future?
- Will values take a sharp downturn in response to the rocky global economy?
If there’s anything we can take away from this data, it is that value trends are anything but linear. Attempting to predict exactly where trade values will end up next is nearly impossible. This is why constant transparency into the market to help strategize your next move is imperative.
Market Optimizer: Your Companies' Crystal Ball into the Trading Market
It’s a fact – uncertainty brings about increased risk, which in turn can result in lost profits. Without a clear understanding of the market, the chances of overlooking potential opportunities are significantly higher. So, how can you effectively gain valuable insights into the export market?
Fisher International, a ResourceWise company, has worked hard to bring the industry the first tool for producers to verify both market size and competitiveness in a single view. Our newest FisherSolve module, Market Optimizer, provides you with a matrix view of our proprietary data. You get a comprehensive view of how your selected mill would compete in multiple destinations worldwide.
Our unique price benchmark offers the following features:
- Your freight hypothetically placed in 100+ destinations worldwide in a single chart.
- Valuable insights into your competitive advantage across different locations with an in-depth analysis.
- The weighted average cost of the top-performing mills in each region providing valuable insights into the strengths and weaknesses of your chosen mill in that particular market.
- Access to data on imports from a wide range of 58 selected countries.
Market Optimizer in Action
Let’s look at what’s going on in Russia’s pulp and paper industry and see how Market Optimizer could be of use.
The Russian pulp and paper industry is currently facing a crisis due to overproduction following sanctions and reduced demand from the Chinese market. This situation has been further compounded by elevated logistics expenses associated with exports.
In the first half of 2023, the volume of production of wood pulp decreased 3.5% to 4,267,000 tonnes, according to Rosstat (Russian Federal State Statistics Service). The production of paper and cardboard declined 4.6% to roughly 4.8 million tonnes.
In the early months of 2023, the price of Russian BHKP in China took a significant hit, plummeting by 43% to $449 per tonne, as reported by Lesprom Analytics. Russia now currently faces excess capacity of approximately 600,000 tonnes of corrugated cardboard.
The situation is set to worsen with experts predicting that this surplus will escalate to a staggering 1 million tonnes. It's important to note that this estimation does not account for the imminent launch of the Ilim Group's new pulp and paper mill in Ust-Ilimsk. The launch could create an even larger stockpile.
Now, let's say a less competitive Russian BHKP mill struggling in the export market wants to change its position. With the help of Market Optimizer, the mill can conduct a detailed analysis of potential export opportunities.
Total Delivered Cost by Country

Source: FisherSolve - Market Optimizer
Let's explore the features of this graph:
- The green column represents the cash cost plus logistics to each destination country.
- The width of the bar is the yearly imported volume of the selected grade in each country.
- The gray bar shows the range of total delivered cost of ALL competitors to the same country.
- The small dots highlight the average of the most competitive mills.
Once the green bar (the total delivered cost of this Russian mill) is almost always below the dots, this mill should have no problems exporting to any other place.
Upon analyzing this graph, our theoretical mill would want to opt for countries in which its overall delivered cost (the green bar) remains lower than the average cost of the most competitive mills (the small dots). Following that, our mill could then select these countries within Market Optimize to further examine the total delivered cost towards specific destinations within the selected countries.
The mill could then utilize FisherSolve to generate a cost curve graph, providing insights into potential competitors and comparative cost advantages. With such a tool, this mill could swiftly and effectively access the necessary information to enhance its strategic position within a volatile market.
Want to learn more about Market Optimizer? Watch our video.
Learn More About FisherSolve

Unlocking Potential in the CPG Industry: Exploring Growth Opportunities
From 2017 to 2023, the containerboard industry has witnessed an impressive compounded annual growth rate (CAGR) of 3.71%. Following the impact of the...
![[Video] Molecules to Markets Episode 2: Electrification, Interest Rates, and Emerging Chemical Market Upside](https://www.resourcewise.com/hubfs/images-and-graphics/blog/chemicals/2026/weekly-video-series-molecules-to-markets/CHEM-Weekly-Video-Series-Molecules-to-Markets-2-CHEMICAL%20PRODUCTS%20SOCIAL%20SPEAKER%20HIGHLIGHT.png)
[Video] Molecules to Markets Episode 2: Electrification, Interest Rates, and Emerging Chemical Market Upside
Markets rarely turn when optimism is loudest. More often, they shift during periods of fatigue—when sentiment is subdued, and pricing has stabilized...
The Future of the TAD Process in the Pulp and Paper Industry
Of all the major pulp and paper grades, tissue and towel is one of the few that directly relates to consumers. While there are others that do the...