4 min read
Brazil Moves from Tissue Importer to Tissue Exporter
 Bruce Janda
:
Mar 30, 2022 12:00:00 AM

Those within the tissue industry know Brazil for its robust eucalyptus pulp production, which is generally used within the tissue segment due to its positive impacts on tissue properties. As a result, Brazil has started to invest in its domestic tissue business, affecting both tissue imports and exports.
Brazil's economy grew until about 2014 when it experienced a secular decline, which started to recover again in 2019 before it was negatively hit by the Covid-19 pandemic in 2020. Figure 1 shows the purchasing power parity adjusted GDP per capita over this interval along with Brazil’s population growth. The country is the seventh most populated in the world, growing at about 0.65% in 2021. Thus, it should be poised for stronger tissue consumption growth if GDP per person continues growing.
 Figure 1: Brazil's Population and Real GDP/Capita Trend
Figure 2 shows Brazil's inflation and unemployment trends over the same time and as we can see, strong inflation began just as growth was declining around 2014. However, inflation returned to low rates in 2017, but unemployment continued to increase to about 14.5% in 2021. This trend would explain why the country's tissue consumption per capita has not increased as much as expected.
 Figure 2: Brazil's Inflation and Unemployment Trend
While early 2021 data suggests a recovery, Covid-19 continues to impact the country’s economy, as shown in Figure 3. The average percent of population deaths spiked in early 2020 before levelling out to a rate higher than the global average. As we can see, the percent of the infected population that has recovered from Covid-19 began to stabilize at about 90% as the pandemic spread through the country. Although one data point does not make a trend, the large spike seen at the end of summer 2021 is concerning and suggests that the effects of Covid-19 on Brazil's economy warrant close attention.
 Figure 3: Brazil's Regional Active Covid-19 Cases
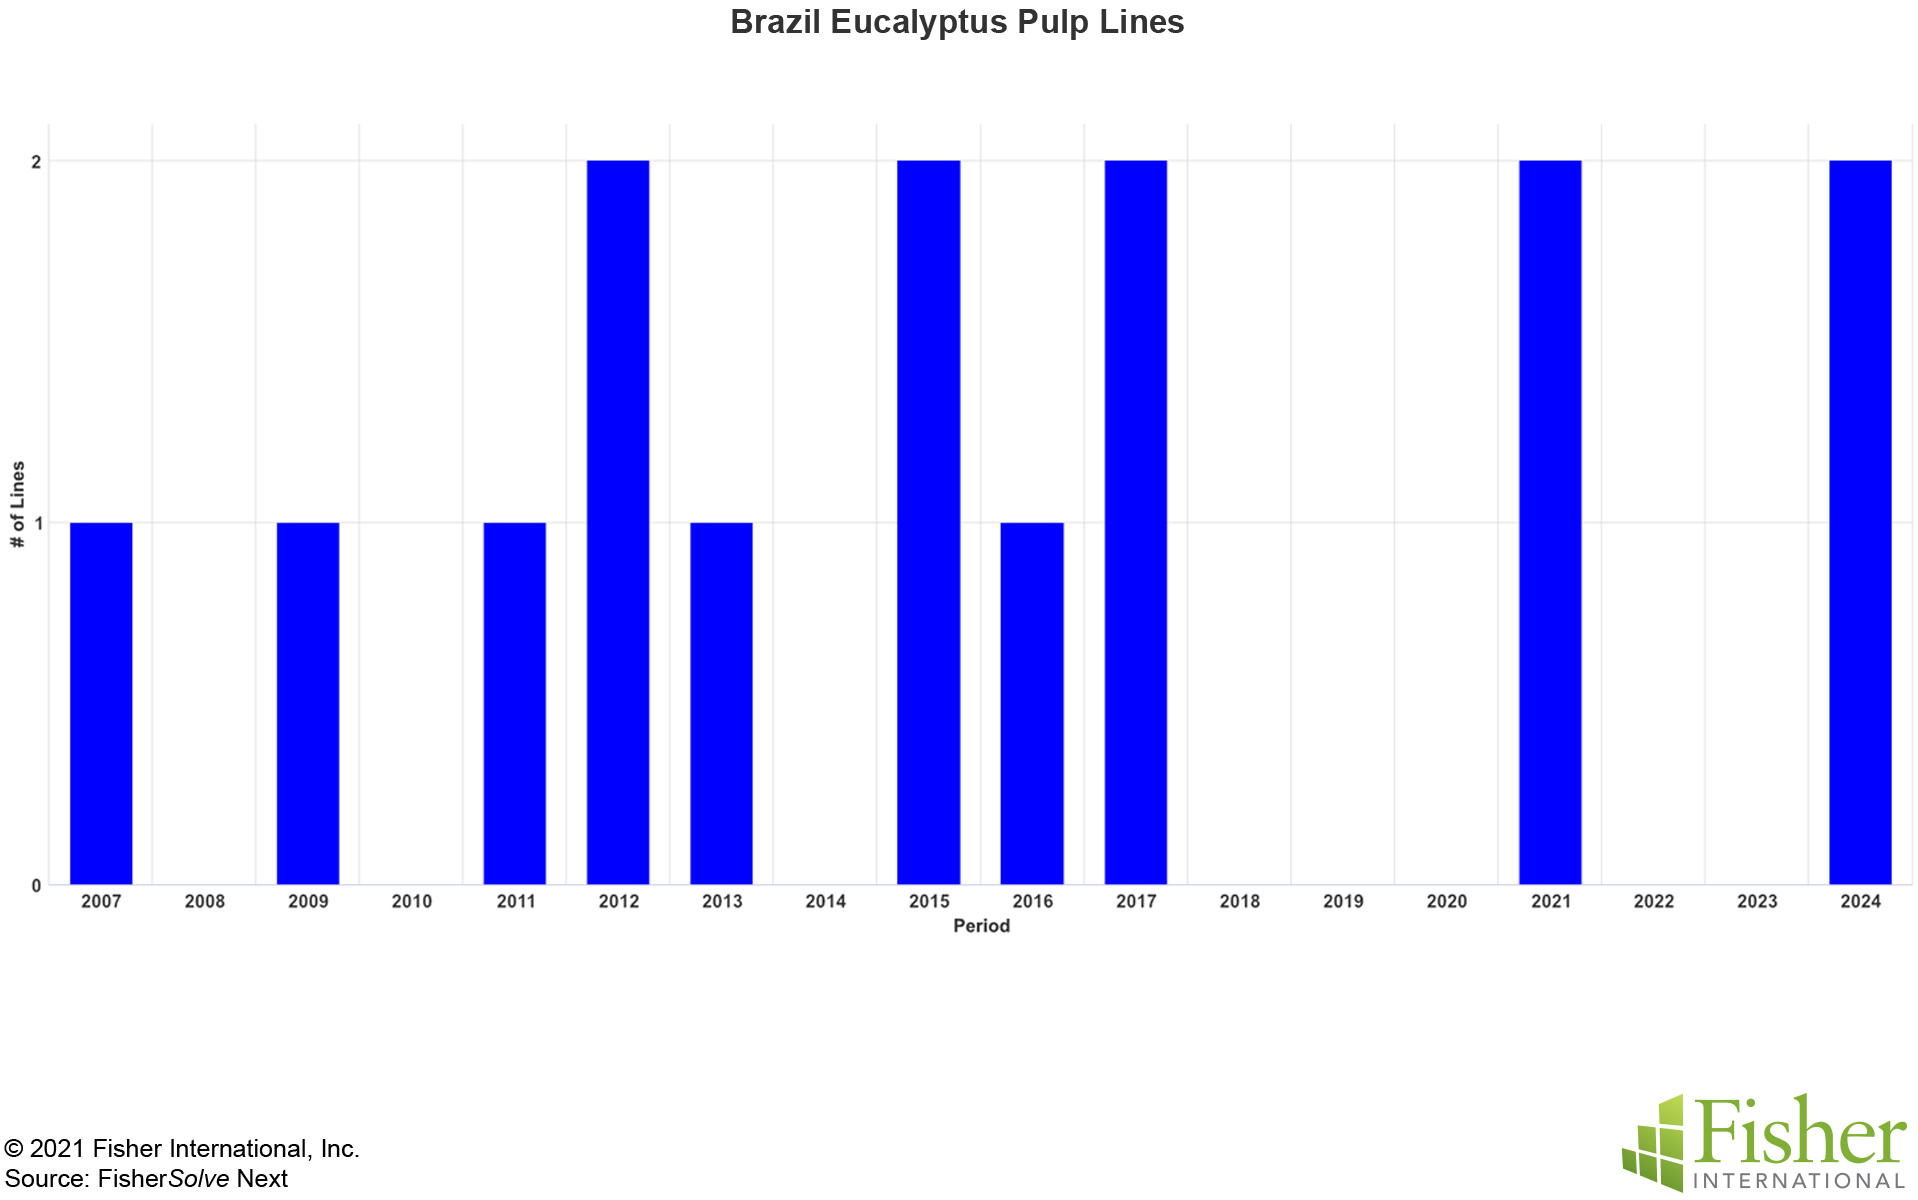
The paper industry tends to think of Brazil as a major exporting power for eucalyptus market pulp. Cloned cultivars and plantation growth have resulted in a six to eight-year growing cycle for the trees. Tissue makers have found that eucalyptus pulp from Brazil or other sources results in excellent formation and tissue softness compared to all other hardwoods. Therefore, it is not surprising that Brazil has continued to add eucalyptus pulp lines to support exports throughout this analysis. As illustrated in Figure 4, 15 pulp lines were added or planned through 2024.
 Figure 4: Brazil's Tissue PM Line Changes
Eucalyptus now represents 24% of total global tissue furnish, as shown in Figure 5 — a major portion of which comes from Brazil.
 Figure 5: Brazil's Tissue Imports Trend
Figure 6 shows the additions and deletions of tissue machines through the time frame discussed in this report. The chart shows the net addition of 11 new tissue machines presumably much larger than the machines being replaced, which are logical moves as Brazil is the source of a preferred tissue fiber.
 Figure 6: Brazil's Tissue Exports Trend
However, eucalyptus does not make up all of Brazil's tissue production, as seen in Figure 7. Almost a third of the tissue fiber comes from recovered paper. Some southern softwood is also used, presumably for strength and stretch properties in selected grades.
 Figure 7: Brazil's Tissue Furnish
Brazil's tissue mills are generally integrated. However, most (60%) are integrated with fiber from recovered paper, which doesn't take advantage of the quality of the eucalyptus pulp. In addition, only 12% of tissue machines are directly integrated into a pulp mill. This appears to be missing a major opportunity for low-cost production by avoiding redrying and transporting eucalyptus pulps.
 Figure 8: Brazil's Tissue Products and Furnish
Figure 9 shows the relative production of finished tissue products. Consumer bath tissue makes up the largest portion of Brazil's production. However, the other categories have room to grow in Brazil's tissue consumption per capita to approach European levels.
 Figure 9: Brazil's Relative Tissue Machine Quality
Brazil tended to import more tissue than it exported up until about 2013. Figure 10 shows the top tissue suppliers, including most of Latin America, the United States, United Kingdom, and Mexico.
 Figure 10: Brazil's Tissue Import Trends
Figure 11 shows the country’s tissue export trends as a mirror image. Tissue exports started to pick up in 2014 and currently run about 15 times higher than current imports. Most exports are directed at the other countries in Latin America.
 Figure 11: Brazil's Tissue Export Trends
The set of countries that have been recently importing Brazilian tissue provide a good comparison base for the competitiveness of the country’s tissue industry. Figure 12 offers a comparison against the Latin American tissue importers that are also producers and the United States. The X-axis provides an average of the country's tissue machine technical age in years adjusted for machine rebuilds and improvements. The Y-axis is the average width of the country’s tissue machines, while the size of the bubble represents the production capacity for each country.
 Figure 12: Machine Technical Age vs Machine Width
Brazil has moderately newer machines, but they continue to be very narrow on average. Bolivia, Peru, and Uruguay all have significantly newer tissue machines but smaller capacities. The United States’ tissue machines tend to be older but almost twice as wide as the Latin American sets.
Each country's relative cash cost of production is shown in Figure 13. Brazil's costs average lower than Uruguay, the United States, and Chile, but are slightly higher than other Latin American countries. Columbia, Argentina, Bolivia, and Peru appear to have higher degrees of virgin fiber integration that support lower costs than Brazil. The relatively narrow width of Brazil's machines also tends to increase production costs.
 Figure 13: Total Cost by Country
Carbon emissions of exported goods are expected to become a significant factor in trade costs or preferences. Figure 14 compares Brazilian carbon emissions versus the comparison set. Only Uruguay has lower carbon emissions per tonne than Brazil, which appears to be in part due to lower carbon emissions from Brazil's tissue mill electricity purchases.
 Figure 14: Carbon Emissions
Brazil has successfully transitioned from a net tissue importer to a net tissue exporter. New tissue machines have both built capacity and replaced old machines to improve industry viability. However, its machines continue to be narrow and have a higher cost than expected. As a result, Brazil's tissue exports appear to be a good fit for its immediate neighbors’ needs, but not a world-wide tissue export powerhouse. This could change if Brazil adds more wide and fast machines to virgin pulp integrated sites. In addition, Brazil's tissue makers have not yet taken full advantage of the high-quality eucalyptus furnish for premium product exports outside of Latin America.
Analysis of competitive position requires specifics on tissue producers and individual machines. This article presents a static summary of Brazil's tissue industry today. Fiber prices, exchange rates, and environmental regulations will change, providing some participants with advantages and others new challenges. In addition, Brazil's tissue mills will continue to change hands and consolidate, and neighboring countries may invest in tissue-making capacity, affecting Brazil's imports and exports.


