
 Harvey Greer
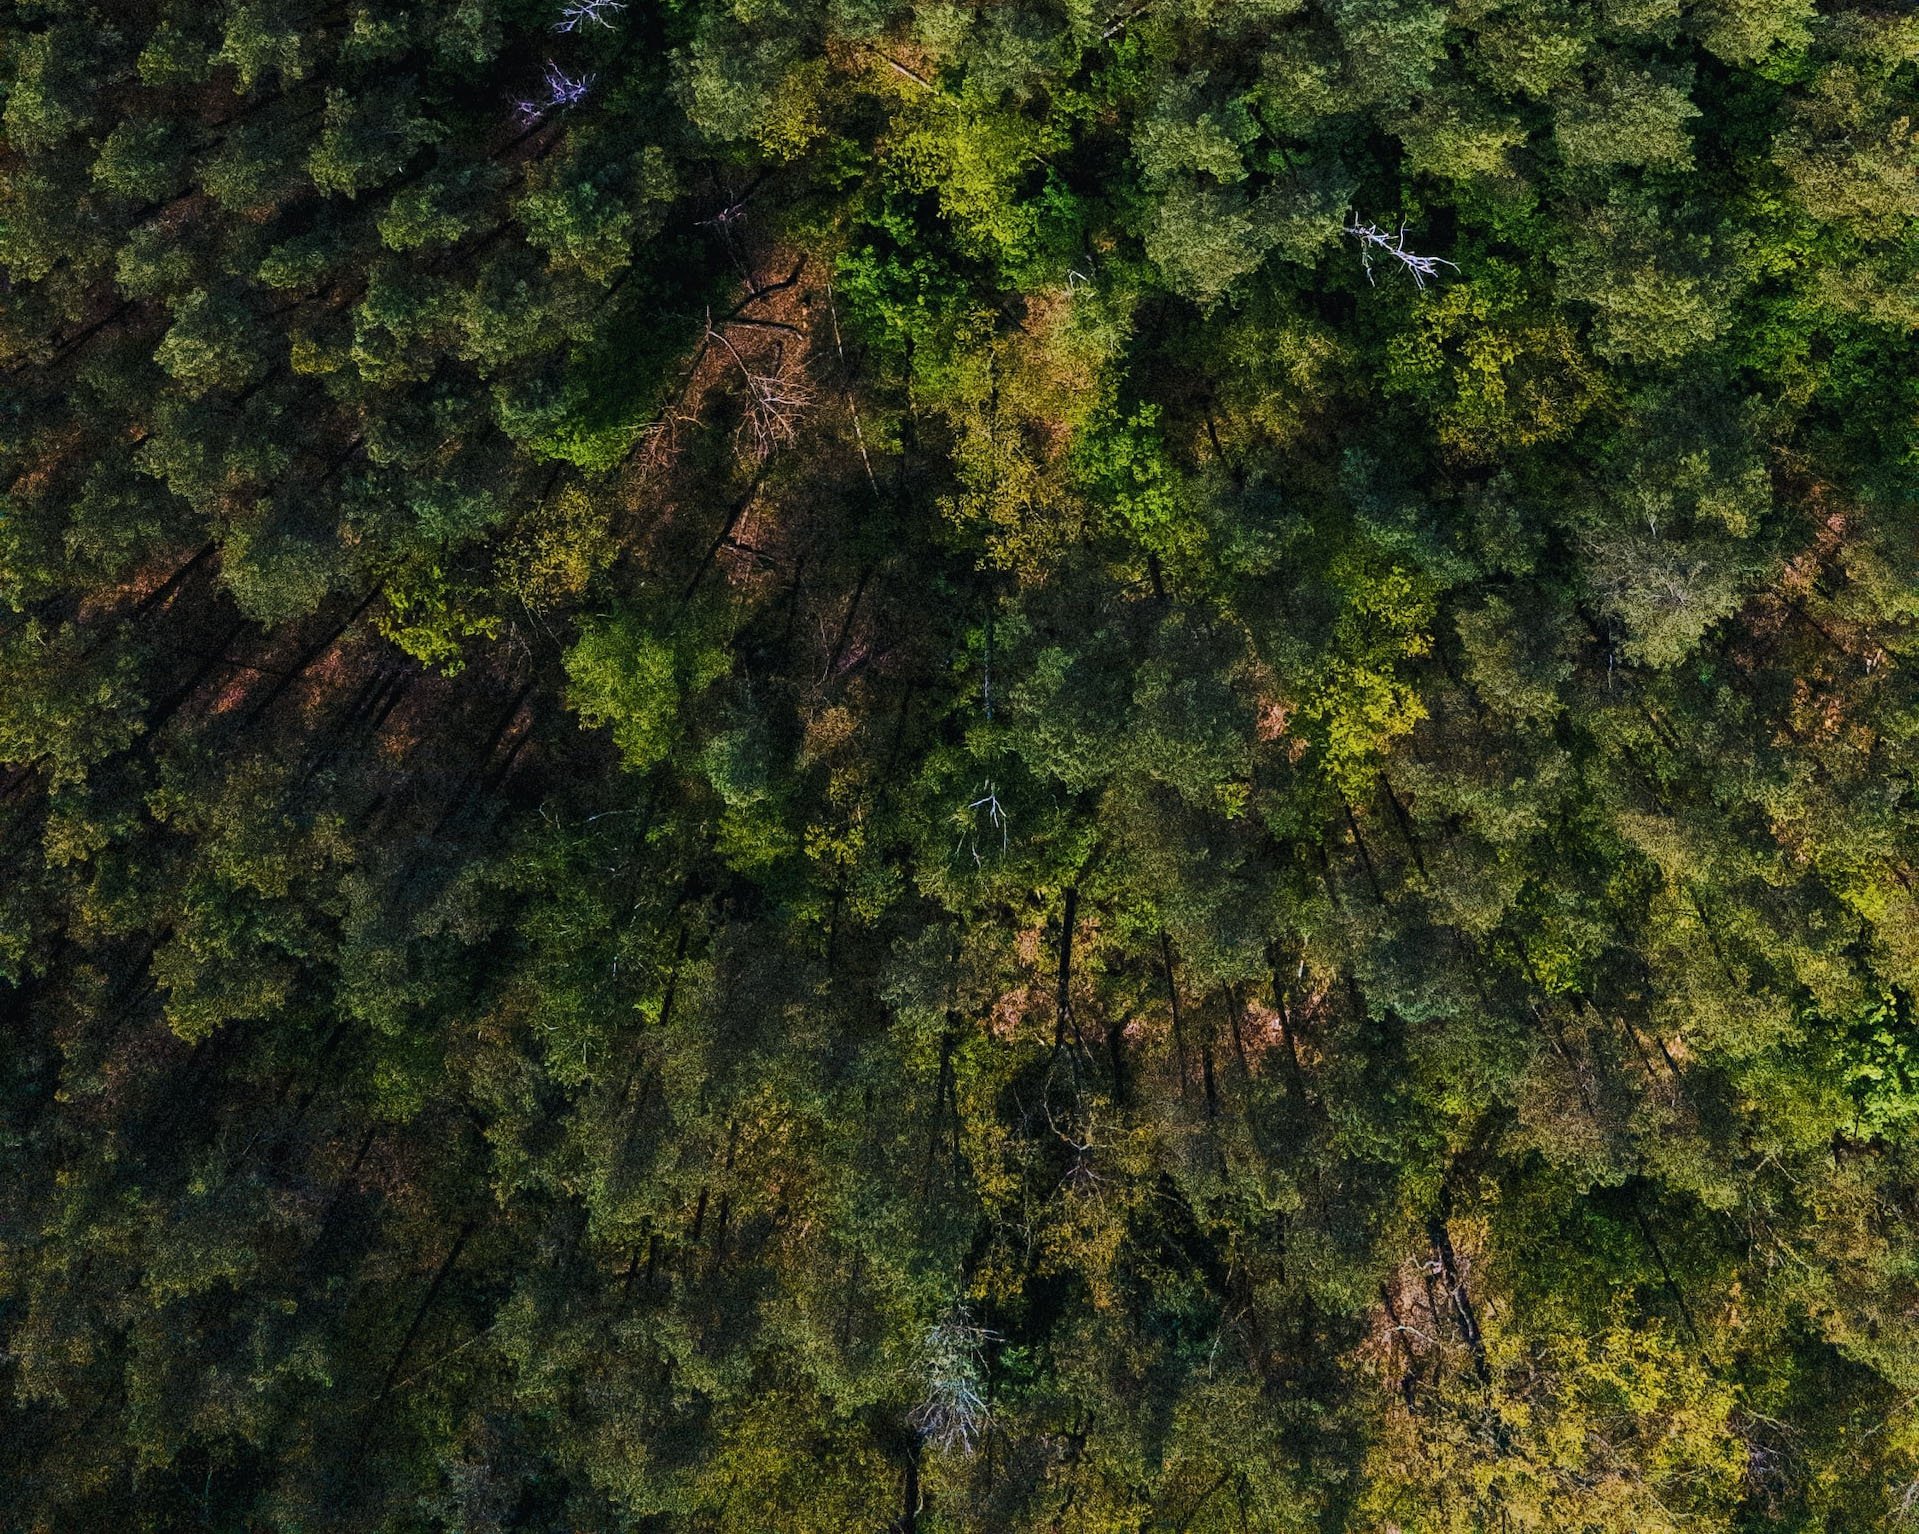
New research out of the University of Copenhagen marks some major changes in how to account for tree carbon stocks. And these changes could lead to significant improvements in climate mitigation strategies.
According to the study, University of Copenhagen researchers created a new method for measuring carbon stocks. The process maps out stocks for trees both inside and out of designated forestlands using data-intensive, multi-layered statistical modeling. By using this more sophisticated modeling technique, trees can be counted much more accurately – and well beyond where the count often stops.
Typical inventories of tree cover inevitably leave out trees growing outside of forests, such as on farms, fields, or in residential areas. This can lead to incomplete numbers and imprecision in carbon stocks relative to emissions.
Using this new tech, tree measurements can better reflect the real number of trees and provide a much clearer picture of their carbon footprint.
Painting a More Accurate Tree Carbon Stock Picture
Better precision in tree numbers during the mapping process can yield impacts in a variety of large-scale resource management efforts. Furthermore, getting a better glimpse of tree numbers beyond forests could help in better responding to climate change.
“This study suggests a rapid, reproducible and highly accurate way to upscale field inventory data collected at the level of individual trees to the entire country,” the article describes. “This will allow tree inventory reports to be of unprecedented accuracy and can support measurement, reporting, and validation (MRV) of climate change mitigation initiatives.”
How Does Tree Mapping Work?
Researchers focused their tree mapping efforts on Rwanda, a varied landscape with some woodlands, forests, farms, and savannas. The system applied a deep-learning model to identify trees with a crown size greater than 0.25m2.
Machine learning was trained starting with over 97,000 human-identified tree crowns. Coupled with satellite imagery, the data informed the automated processes to map about 355.27 million additional trees.
Data from field campaigns and other sources was used to determine the various stem diameters of the trees. Clumped crowns of trees were also separated based on predictive modeling. In turn, this provided much stronger insights about forest density and the total carbon stock of each tree.
Prior estimates of carbon stocks were determined on an aggregate basis. This new tree mapping method standardizes how these figures are gathered and prevents ambiguities across data sets.
For instance, some countries or regions may designate forests based on one set of criteria while others may have different standards. Utilizing the machine learning method removes these ambiguous classifications for how tree cover and carbons stocks are measured.
Big Potential in Climate Change Mitigation and Policymaking
One of the most vital elements to this new development is how it can impact climate change intervention and large-scale policy. But a large roadblock to this progress has come thanks to gaps in the data.
Other tree mapping systems can measure and report tree carbon stocks in designated forestlands or other large groupings of trees. This only captures part of the story, however, leading to an incomplete picture of a region’s carbon stock.
As study author Dr. Maurice Mugabowindekwe explains, their innovative technology can close those data gaps. “Large uncertainties exist for the current forest assessments internationally. By mapping the carbon stock of all individual trees, accuracy is greatly improved.”
Individually mapping trees can better assess their collective carbon content. By capturing the whole picture, the data can directly impact larger-scale sustainability strategies such as policymaking.
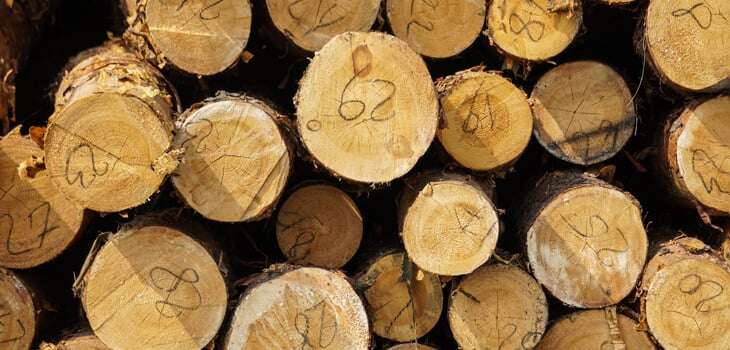
What It Means for the Forestry Industry
Traditional tree counting usually determines estimates in designated forestlands. As a result, the numbers are considerably lower than the actual tree numbers in a given region.
In this case, typical forest delineation and counting missed 38.4% of isolated or non-forest trees in the Rwanda numbers. Those missed trees reflect 25.5% of the aboveground carbon stock in that region.
So, to reiterate – over a quarter of a region’s potential carbon stock was omitted before using the new machine-assisted method. Such high numbers could have real, direct impacts within the forestry industry.
Although the method has its limitations, it carries some worthwhile potential scaled out beyond Rwanda. By improving the process, forestry can better integrate into larger-scale strategies in agriculture, forestry, and other land use (AFoLU) management. As sustainable initiatives and practices become the norm, comprehensive climate change mitigation can better support these industries.
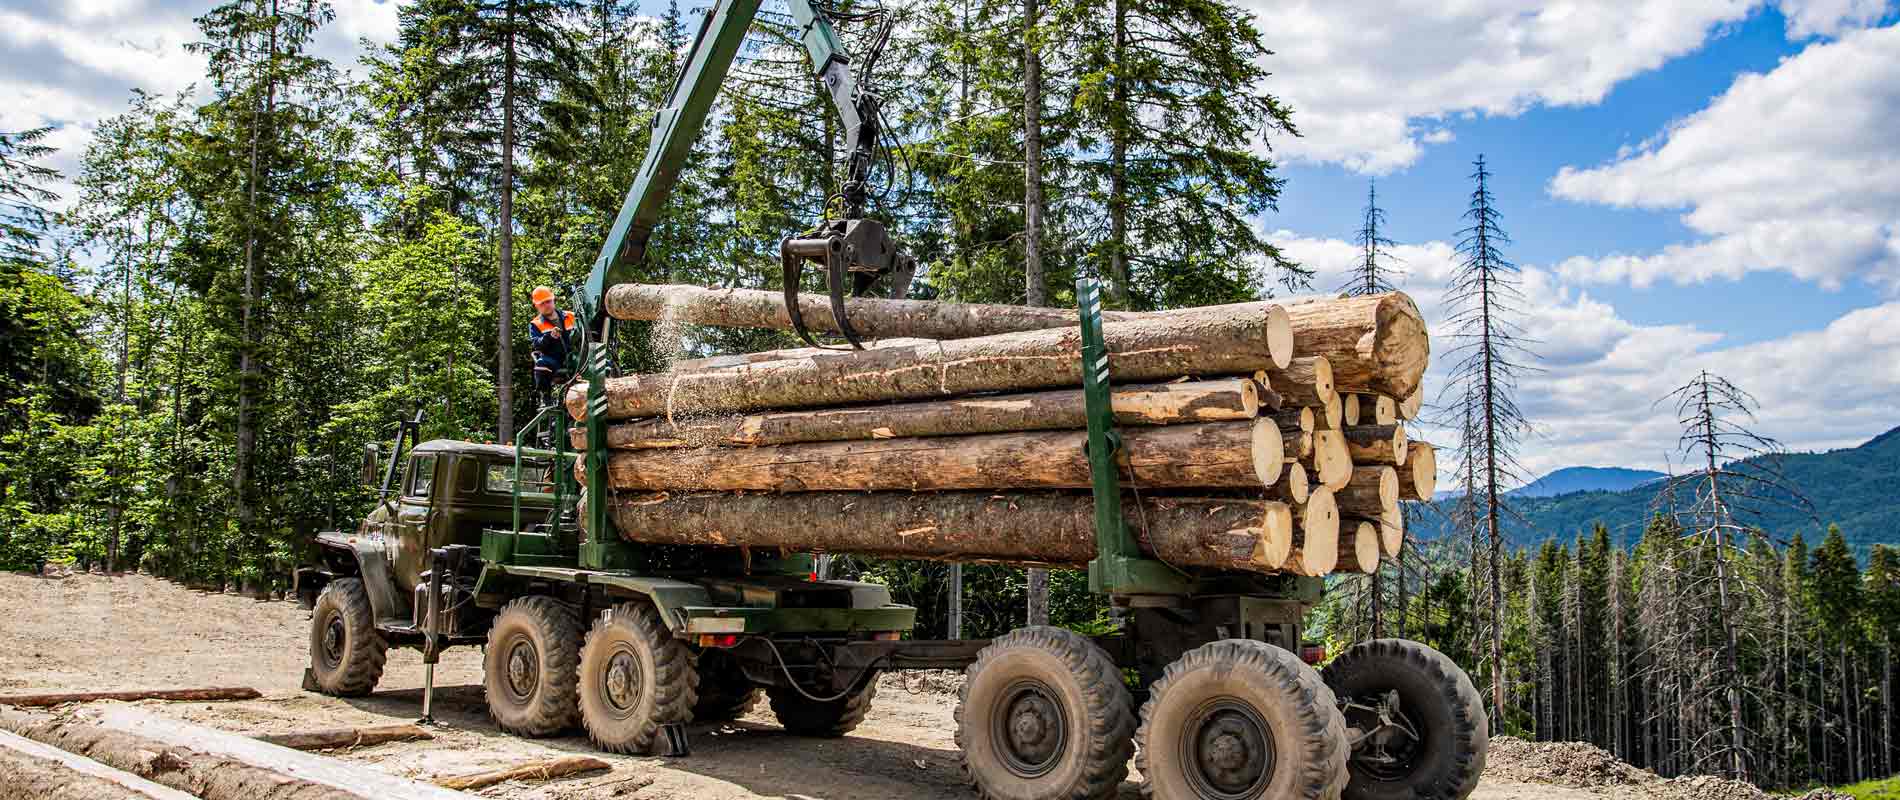
Landscape-Level Forestry Data with Timber Supply 360 and Carbon 360 from Forest2Market, a ResourceWise Company
New methods for measuring trees and their carbon stores will become instrumental for long-term sustainability planning. Today and into the future, companies in the industrial forest products industry require tree and carbon measurement tools to help them understand, measure and demonstrate their own resource use and carbon impacts.
Forest2Market's Timber Supply 360 and Carbon 360 are the only tools which provide landscape-level data related to forest inventory, harvests, growth and carbon stores. Businesses involved in the forest value chain utilize this information every day to inform their planning and improve their decision making.
The platform provides satellite imagery with Timber Supply 360 Latin America. Area-specific data like hectares, species volume, and age-class can support investment decisions. Both growth and yield modeling also provide insights in long-term forecasting, local demand, and other key factors.
US-based forestry data is pulled from the US Forest Service and accessible through Timber Supply 360 North America. The tool provides flexible, data-driven analyses adjustable by growth, removals, acres, inventories per acre, and more.
Using this data, Forest2Market also offers industrial forestry companies Carbon 360, a system that allows timberland owners and pulp & paper/wood products manufacturers to measure their own carbon footprints. These solutions are all available through SilvaStat 360.


Keeping Pace with the Forest Products Market: A Close Look at Finland's Forestry Update
The forest products market worldwide is anything but stagnant. With various factors such as weather conditions, policy changes, and global demand...
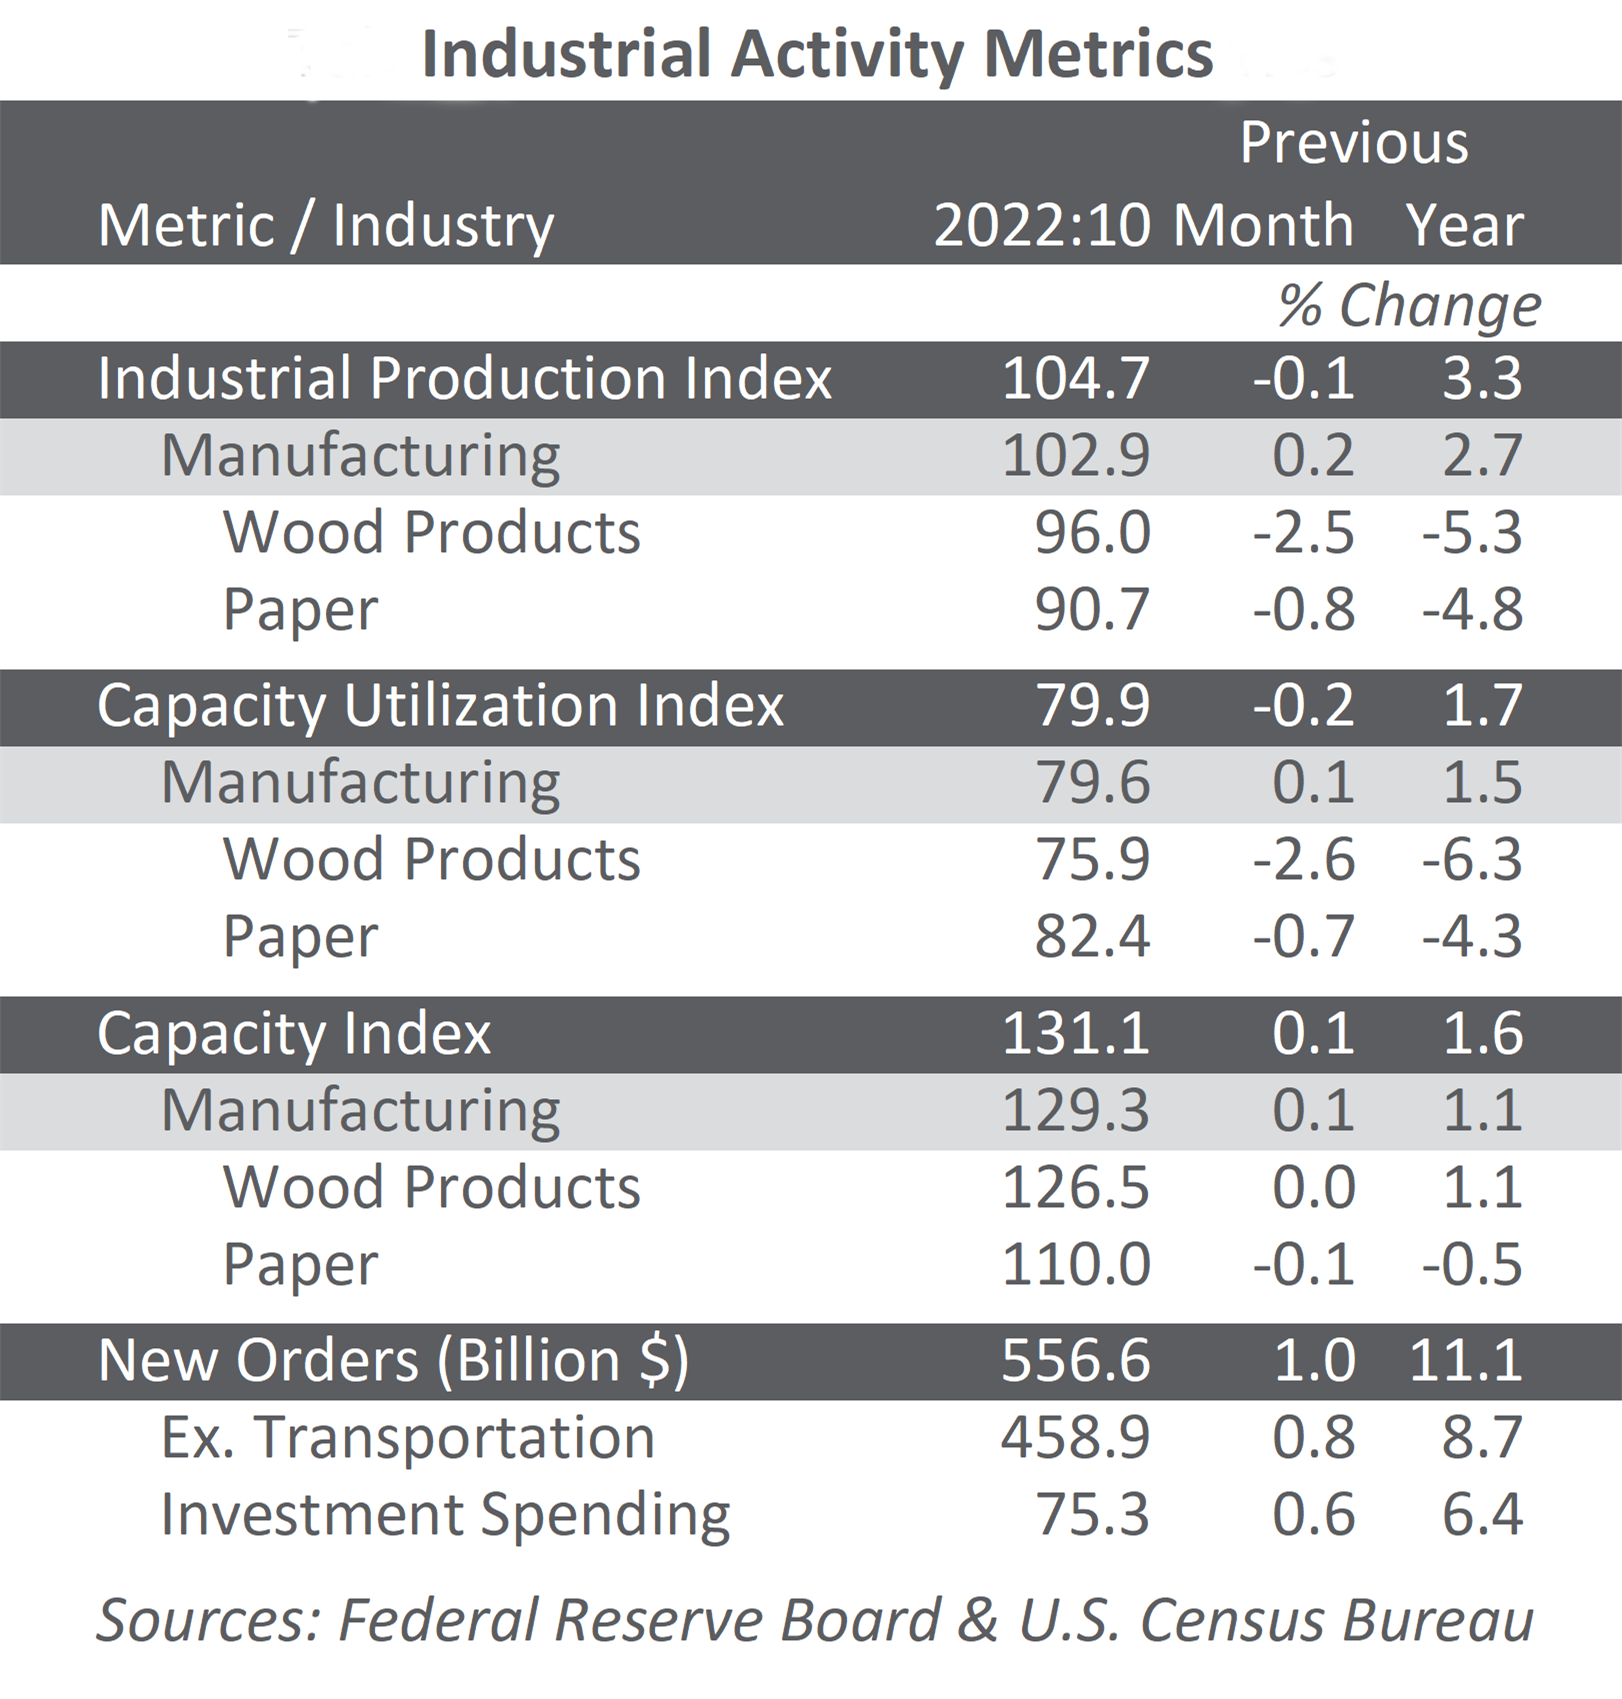
Steady Pace in Forest Industry Manufacturing with Only Slight Decline
US forest industry performance in October and November 2022 was recently reported by both the US government and the Institute for Supply Management.
Boosting Mississippi's Forestry Industry: The Impact of New Federal Truck Weight Limits
The forestry industry of Mississippi is bracing itself for a game-changing shift, following President Biden's recent signing of the FY2024...