
 Urban Lundberg
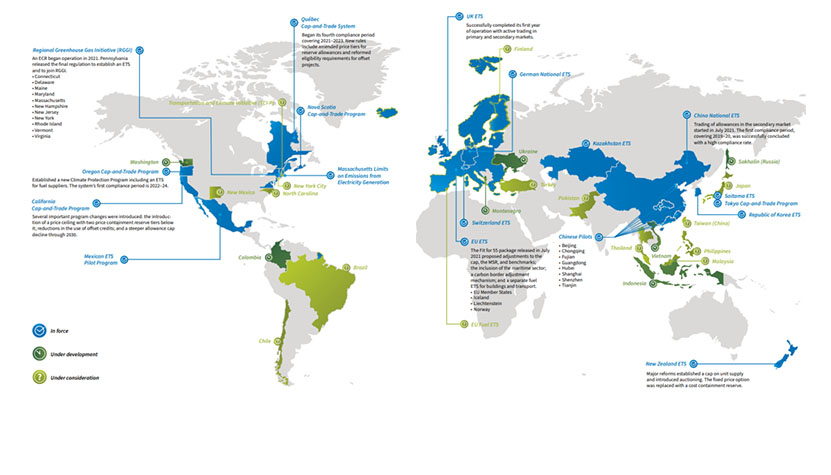
Decarbonization is becoming an increasingly important topic globally and at all levels of the value chain as governments increasingly turn to policy to drive desired environmental outcomes – the most common forms being either carbon taxes or an Emission Trading System (ETS). One of the most prevalent examples of this is the ‘Fit for 55’ package that the European Union (EU) Commission proposed in 2021. This ambitious piece of climate legislation was created with the goal of reducing greenhouse gas (GhG) emissions by 55% by 2030 in order to make the 2050 carbon neutrality objective achievable.
There is a true global commitment taking shape around achieving these goals, as illustrated in the image below, which illustrates individual countries and states/territories that either have legislation in force, under development or under consideration.
 Source: International Carbon Action Plan
In addition to global solutions at the policy level, multinational companies (such as Apple, Amazon, Unilever, Starbucks and Nike) are also joining in the decarbonization effort and pushing sustainability issues to the forefront of their corporate agendas with pledges and actions to achieve net zero emissions. Procurement-level decisions are now being made with regard to the sustainability of suppliers, which is even more important for the energy-intensive Pulp & Paper industry. Carbon impacts of individual mills are being compared to their peers, and information about the upstream carbon footprint is being requested.
Global brands want to decrease their carbon footprints, which begins with an accurate measurement. However, this is easier said than done for a number of reasons.
Firstly, precise reporting is difficult. Emission calculations can and are being reported over or under by as much as 50%. “The measurement, target-setting, and management of Scope 3 is a mess,” said Anant Sundaram, a finance professor at Dartmouth College’s Tuck School of Business. “There is a wide range of uncertainty in Scope 3 emissions measurement… to the point that numbers can be absurdly off.”
Secondly, it doesn’t appear that a Life Cycle Analysis (LCA) is enough. Per the Organization for Economic Development: there is no single LCA method that is universally agreed upon; different boundary definitions will produce very different results; and there is a lack of comprehensive data for LCAs, meaning there would be reliance on questionable assumptions and databases. And in many cases, the cost of the LCA data available is at too high of a level to enable large brands to make actionable decisions on specific products.
So, what are some attributes of reliable carbon benchmarking for participants in the pulp & paper value chain?
- Modeling is consistently applied.
- The model is based on the fundamentals of pulping and papermaking: a mill’s assets and process (no individual mill ever runs the same year-to-year).
- Enables segmentation by product and company and considers various supply chain configurations.
With currently 3,500+ mills producing hundreds of mill-paper combinations worldwide, can we really expect an LCA for millions of combinations to be feasible?
At Fisher, we believe this problem can be solved by applying sophisticated analytics to our comprehensive datasets that describe every pulp and paper mill in the world. By taking a systematic approach and basing our models on fundamentals, we can correct the issues found in much of the carbon emissions reporting and provide an “apples-to-apples” comparison for consumers.
Our Unique Approach
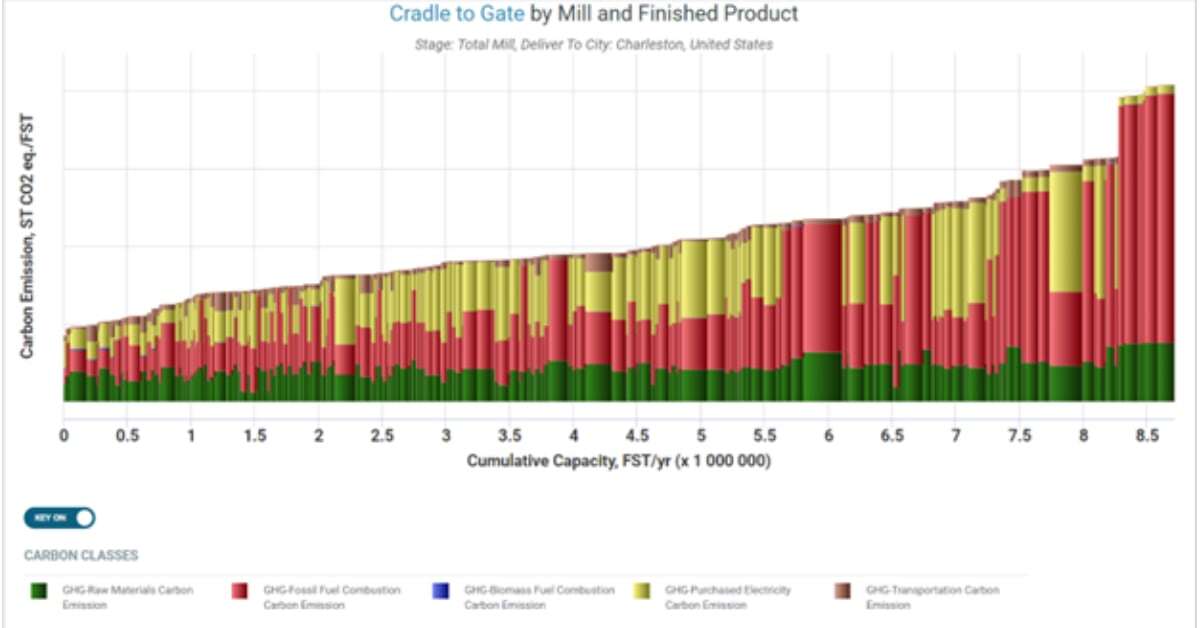
Our model starts with a fundamental view of a mill’s capacity, grade mix, and process flows’ given constraints. Once a carbon benchmark is built from the primary principles, methodology is applied consistently to all paper machines in the database. By linking mill and asset data together, it enables us to understand the “why” of it all.

In order to make better sense of this, let’s look at a hypothetical use case. Selling over 474 million products over the last year, Apple has had to use an equivalent amount of packaging to distribute its products to its customers – meaning a lot of Folding Boxboard (FBB) was created for Apple alone. For our hypothetical case study, we are going to see what kind of carbon impacts shipping FBB to Vietnam has and what the possible decisions companies in Vietnam could make based off this information.
Imports of FBB to Vietnam by Country

Source: FisherSolve
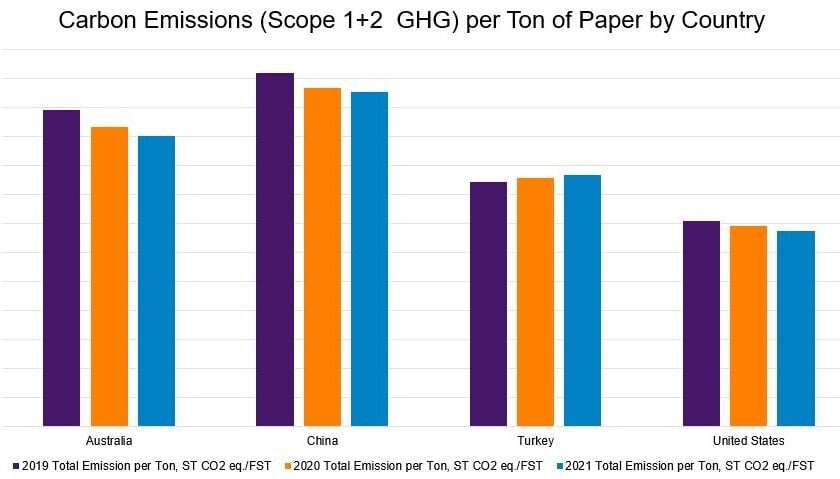
As we can see from the 2021 data, China, India and Indonesia are amongst the top exporters of FBB to Vietnam. Next, when comparing the carbon emissions of some of these countries, we can see that China and India FBB mills, on average, have nearly twice the carbon intensity compared to Finland and Sweden.
Carbon Emissions of FBB to Ho Chi Minh, Vietnam

Source: FisherSolve
This type of carbon benchmarking can be used by end users to determine if new suppliers (and in this hypothetical case, mills in Brazil) would lower their GhG impact.
 Source: FisherSolve
However, when we look even closer at the individual mill level, we can see there’s actually a Swedish mill that has an even lower modeled GhG impact.
 Source: FisherSolve
In this case, our hypothetical buyer can use both costs and carbon models to inform their decision-making.
Buyers of pulp, paper and resulting converted products are increasingly seeking reliable carbon data to incorporate into their strategic planning and decision-making. But based on our discussions with end users, existing datasets are often not sufficient; they are not granular enough and lack the apples-to-apples comparison that is needed, especially when sourcing from myriad countries.
FisherSolve’s carbon and cost models are used by stakeholders to address these issues, and we’re seeing an increase in demand for the data. With information on the carbon footprint of every pulp line and paper machine for each of the products they produce - all the way from cradle to destination - consumers now have more information than ever at their fingertips to ensure their procurement practices match their corporate visions.


The Industries of Chemicals: How Key Markets Shape Global Demand
The SEC GHG Reporting Guidelines Are in Place – How Might They Impact Tissue Producers?
The proposed SEC reporting schedule will require publicly traded firms, which most tissue and consumer packaged goods (CPG) companies fall under, to...
How Will the EU’s New GHG Emissions Import Tax Affect the P&P Industry?
What Is the EU’s New Tax on Imports Based on GHG Emissions? At the beginning of December 2022, the European Union reached an agreement to impose a...

July Sustainability Successes in the Pulp and Paper Industry
As global markets place increasing emphasis on sustainable practices, the pulp and paper industry is leveraging this momentum to drive innovation and...