 Jane Denny
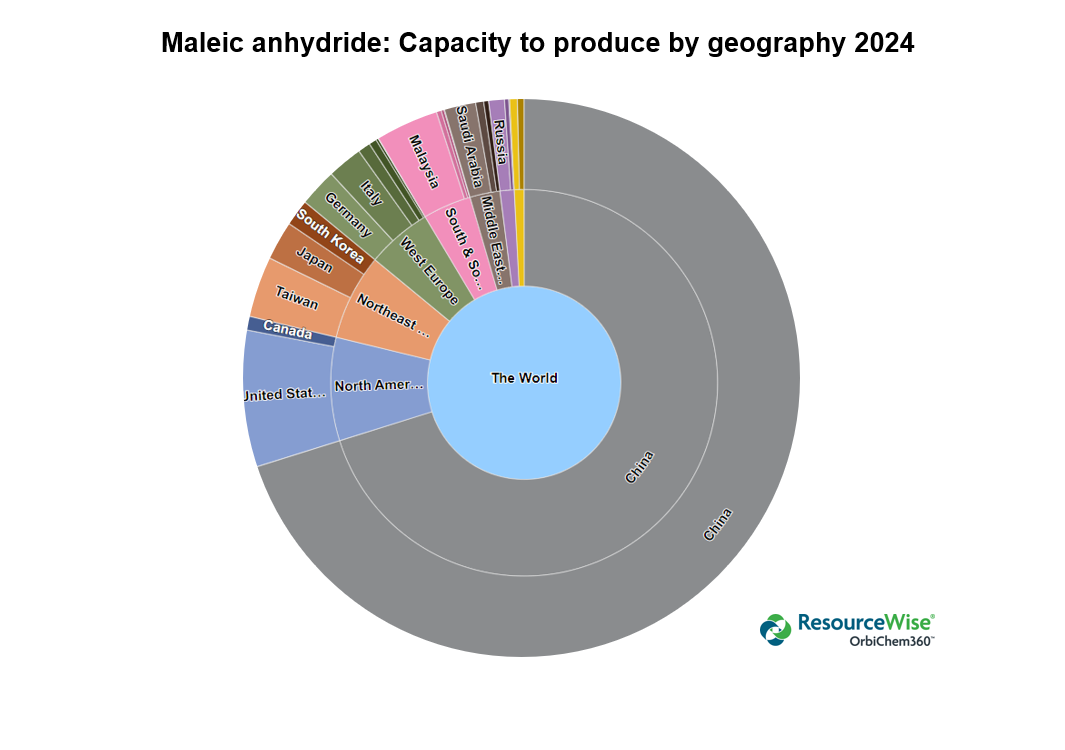
Maleic anhydride is an important intermediate chemical. Currently, capacity to produce is in excess of 5000 ktpa globally. Over two-thirds of the producing plants and facilities are located in China.
Used in production processes for a plethora of products including coatings, paints and lubricating oil additives, barely an area of chemistry industry exists without its input.
China’s capacity to produce maleic anhydride has increased significantly this decade—and is set to grow more. North America is the second largest producer, followed by Northeast Asia and West Europe.
Market shares for maleic anhydride production are shown in the infographic below.

Behind Russia (and indicated by the yellow-colored pie pieces) are Brazil and Argentina. The chemical business intelligence platform OrbiChem360 from which the graphic is taken shows each region and country's capacity to produce to the nearest kiloton.
Fortifying Unsaturated Polyester Markets
The biggest downstream market for maleic anhydride is unsaturated polyester resins (UPR). Automotive body parts for example, are made of fiberglass reinforced plastics, which rely on the UPR versatility and cost competitiveness, and MA in turn. UPR underpins construction and housing projects and infrastructure, architecture and structure worldwide—these latter three in China in particular. However, there is little evidence that these China’s construction related UPR markets are recovering. Maleic anhydride (MA) markets remain flat there.
Download a copy of the eBook to take a deeper dive into the dynamic landscape of the maleic anhydride market.

Recent, and more widespread, downturns in housing and construction sectors are hitting hard. True, there was a slight uptick in Europe's UPR market in January 2024. But it appears the increase in activity came from hesitant buyers holding out for better deals… That’s not exactly the green shoots of recovery the sector needs.
US housing projects also demonstrated a downward trajectory in January 2024. There were just 314 profitable start-ups of housing units above five dwellings during the first month of this year. For perspective, when the subprime mortgage crisis impacts began to take significant hold in April 2008, that figure was 316. That marked a relatively high compared to the five years, thereafter. From 2010, housing startups of this size dropped lower than had been seen in 60-plus years of record-keeping. Surely, we are not poised for a repeat of this woeful time.
Output Caps Versus Capacity Boost Post-COVID
Maleic anhydride (MA) plants are running at significantly low operation rates at present. Not since pre-Covid times has utilization topped 80% of total capacity.
China grew its capacity to produce MA significantly in recent years, adding over 400 kilotons per year to its production capacity. A key driver for that investment and growth trajectory was that demand for MA was on an upward trend.
In the five years to 2018, MA’s CAGR was over 2%, a figure that at that time (before Covid and the latest tranche of geopolitical wranglings took hold) was expected to be 3.4% between this year and 2030. With China’s demand for MA expected to consume nearly half MA’s global production at that time—and the country expecting overall growth rates higher than the rest of the world—expansion was prudent.
But it is those lofty predictions that have put the subsector where it is now… Namely facing the prospect of more new output coming on stream in 2024 on top of the several hundred kilotons per year realized in 2023.
That has created a scenario in which it is hard to see how the prices for maleic anhydride can firm, at least in the short term. Indeed, as ResourceWise's maleic anhydride expert Kaiyin Hu outlines in the eBook, negative consequences are likely.
Increasing the supply of MA in China is expected to add further pressure on the already oversupplied market, weighing heavily on margins.
Kaiyin Hu, Senior Consultant, Chemical Sector, ResourceWise
"Increasing supply of MA in China is expected to add further pressure on the already oversupplied market, weighing heavily on margins,” Hu observes.
Mapping Maleic Anhydride Trade Flows
The infographic below shows only the top trading countries for maleic anhydride from March 2023 (as opposed to OrbiChem360 which shows all trading nations). It shows clearly how significant China's trade is. It also shows that the US is a major exporter, with Taiwan, Malaysia and South Korea making up a fair proportion of export
Maleic Anhydride Feedstock Impacts
As of 2024, n-butane is the key feedstock in MA production. The majority of producers use n-butane as the raw material with a very small ration produced via phthalic anhydride recovery. The remainder, though this in itself represents under 15% of total global production, relies on benzene feedstocks.
The graph below shows spot prices for hydrocarbon gas liquids including n-butane. There is a strong correlation between the peaks and troughs in the cost of crude oil and those of n-butane. As shown in the eBook, the spot price for n-butane is nearly $500 per ton in the US today.

The graph below demonstrates how diligently US maleic anhydride spot prices followed spot n-butane pricing structures between 2015 and the start of 2021. However, in 2021 divergence began to appear between the prices for these two products. Download our free eBook to see an updated version of this maleic anhydride feedstock graph which includes timeframes up to and including 2024.

Product and Feedstock Costs Crystal Ball
ChemForesight—a long-term price indicator with short/medium-term commentary—is published monthly. Such frequent revision is necessary because chemical price trends can turn within days. Factors impacting prices include the price of crude oil rising or sliding, or unexpected plant stoppages, and extreme weather conditions. These spontaneous disruptors create the need for forward-looking insight that is no more than a few weeks old.
Forecasts present prices for energy cases benchmarked to three crude oil scenarios. Subscribers may choose their preferred scenario or interpolate between the three versions offered. We modify the scenarios monthly so that the base case represents the most likely outlook at the time. 'High' and 'Low' cases allow for possible changes in the oil markets, or other energy sources, in the following weeks.

The three different crude oil scenarios—shown by the blue, red, and green lines— allow subscribers to judge the effect of deviations from the base predictions.
We use Brent crude oil price to index feedstock and energy costs, adjusting for non-petroleum sources (such as natural gas, coal, and electricity).
The graph above is the ChemForesight forecast chart for the chemical 1,4-Butanediol (also called BDO) which is mostly produced from MA, but also from acetylene. The above graphic shows the forecast we made in September 2022.
The forecast shown for Q4 2023 has turned out to be very good, though the forecast for Q1 2024 is so far looking a bit high. Today, our ChemForesight graphs show the price level up to September 2025, 18 months in advance of today.
Incorporating Market Balance to Pave the Future
The supply and demand databases within OrbiChem360 allow us to pinpoint average plant utilization rates. These remain fundamental inputs to our forecasting technique.
The utilization graph below is from our chemical business intelligence platform OrbiChem360. The graph shows global maleic anhydride actual production versus capacity to produce between 2014 and predicted to 2029. The downward trend in capacity utilization (orange line) compared to the upward trend in capacity to produce (purple line) is consistent. The graph demonstrates that many plants in the maleic anhydride value chain cut production rates—or stood idle—from 2021 onwards.

Maleic anhydride markets remain complex trading environments. It is becoming more difficult to assess the impact on the current marketplace as spontaneous geopolitical, and or supply chain-related issues, disrupt trade flows.
Download our latest eBook to gain some insight into its drivers as of Q1 2024 and to see price forecast charts for both MA and BDO to Q3-2025.
Download a free copy of the eBook to dive deeper into the dynamic landscape of the maleic anhydride market.
Bio-Bunker Premiums Rebound as Oil Market Disruption Eases

45Z Final Rules are Coming in November. Now is the Time to Plan.

Chlor-Alkali Markets: What is Happening in 2024
The global chlor-alkali industry is locked in turbulent times. As efforts by producers to mitigate the sector’s long-term availability issues...
![[Video] Molecules to Markets Episode 1: Chemical Markets Begin 2026 in a Supply-Driven, Margin-Sensitive Environment](https://www.resourcewise.com/hubfs/images-and-graphics/blog/chemicals/2026/weekly-video-series-molecules-to-markets/CHEM-Weekly-Video-Series-Molecules-to-Markets-Episode-1.png)
[Video] Molecules to Markets Episode 1: Chemical Markets Begin 2026 in a Supply-Driven, Margin-Sensitive Environment
Week 1 Chemicals Market Update | Featuring Steve Wilkerson, North American Director of Chemical Sales, ResourceWise

Middle East Tensions Ripple Through Energy, PVC, and Chlor-Alkali Markets
Rising Oil Prices Increase Energy Costs for European Producers Brent crude prices have risen in recent days amid geopolitical tensions involving...