Timber Supply Analysis 360
Comprehensive datasets for improved decision-making.
The only product for the forest value chain that offers a full-spectrum view of data on regional timber growth, inventory, and harvests.
Streamlined Inventory Analysis
Gathering reliable forest inventory data used to be a cumbersome, time-consuming process in the US. Timber Supply Analysis 360 simplifies the process with up-to-date, basin-specific data in the US.
Data-Backed Tools
With superior data from four individual providers in the US, subscribers can identify the forest inventory data they need, making it a manageable task.
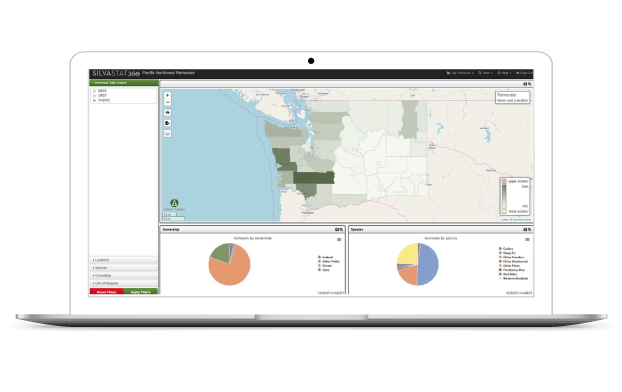
Flexible Views
In addition to inventory, the interactive maps also display:
Acres/Land Acres, Growth, Removals, Growth/Removals, Inventory per Acre, Growth per Acre, Growth/Inventory, Removals per Acre and Removals/Inventory

Take Advantage of Timber Supply Analysis 360 Today