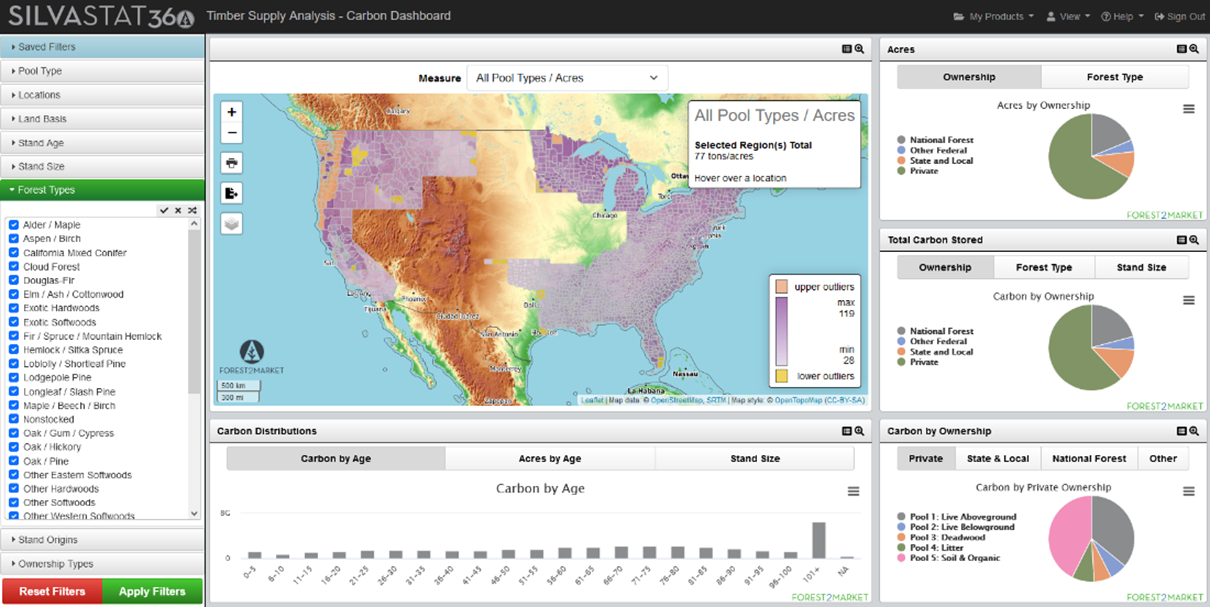
Visualize forest carbon storage data for ESG reporting.
Carbon Analysis 360 offers a full-spectrum view of carbon metrics essential for meeting sustainability criteria and certification schema in a single platform. We help everyone from:
- Timberland owners
- Manufacturers of pulp, paper, or wood products
- Importers or exporters of US wood raw materials
Timberland Owners
How many tons of carbon are stored in the supply basins in which we operate? How do our land bases compare to other land bases, and how are we materially impacting carbon stored in our basins? Do we have the ability to plan for or participate in forest carbon markets?
Pulp, Paper and Wood Products Manufacturers
What does forest carbon storage look like across the entire mill system and in each of our procurement zones? Can we identify new opportunities to work with carbon-conscious wood suppliers in these basins? Can we provide demonstrable carbon-related data to our customers that helps secure long-term contracts?
Exporters and Importers of US Wood Raw Materials
How can we verify the carbon claims of our suppliers? How can we prove our wood raw material supply chains meet certain carbon-related sustainability criteria and chain-of-custody requirements?
Interactive maps, charts, and tables to help visualize forested geographies and corresponding carbon data, down to the county level. Select forest carbon pool types to investigate:
- Live Aboveground
- Live Belowground
- Deadwood
- Litter
- Soil & Organic
Filter for location and land basis, stand age, size and origin, forest type, and ownership type. Refine and categorize data based on pool type. View in aggregate or by tons per acre. Data and visualizations can be downloaded and exported.


