One of my favorite places to visit is Disney World’s Magic Kingdom in Orlando, Florida. I view it as a utopia and how the world should be: just good, clean fun (though it would be much nicer without the heat!). One of my favorite rides at the park used to be Mr. Toad’s Wild Ride. Unfortunately, like some of the sawmill capacity in the South, Mr. Toad’s Wild Ride is no longer there. For those of you who may recall, Mr. Toad’s Wild Ride was nothing exotic; it wasn’t even a rollercoaster. It was a ride that took you through the dark and uncertain world of Mr. Toad, turning you left and right and throwing obstacles and random characters out at you. Near the end of the ride, you are approaching a head-on collision with a train and end up in hell!
Looking back on the last 4.5 years in the sawmill industry, it almost feels like Mr. Toad’s Wild Ride. The question is: are we approaching that train or, worse yet, are we standing at the gates of hell?
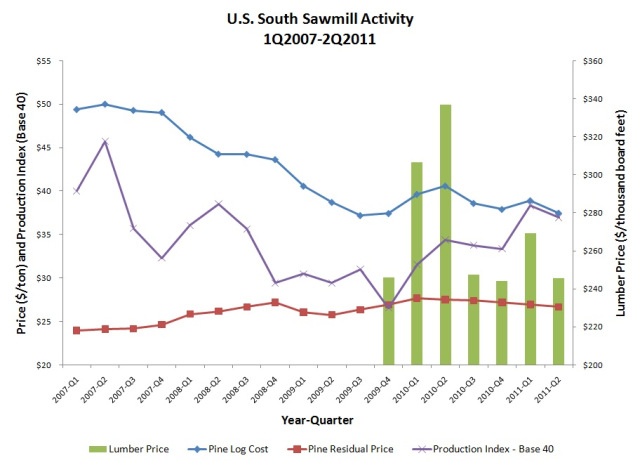
I hope I can answer that question, but first let’s look at Figure 1. In this chart, I have plotted sawlog delivered prices, residual chip prices (FOB sawmill) and lumber production – all sourced from our Forest2Mill benchmark service. I have also plotted our lumber prices sourced from our Mill2Market report that began in 4Q2009. Looking at Figure 1, we can see the wild ride the industry has been on since 1Q2007.
Figure 1: Sawmill Activity 1Q2007-2Q2011
There are two distinct trends in this chart that stand out to me. The first trend occurs from 1Q2007 until 4Q2009. Following the condition of the housing market, lumber production fell significantly during this period, albeit with spikes here and there. Production fell from our base index of 40 (chosen solely for the chart’s scale) in 1Q2007 to 27 in 4Q2009, a reduction of 33%. As a result, sawlog prices rapidly declined from around $50.00/ton delivered to about $37.50/ton, a 25% decline. Ovder the same period, residual prices or revenue for sawmills increased from around $24.00/ton to $27.00/ton. (Because Forest2Market started its lumber price reporting and benchmark service in 4Q2009, I do not have lumber prices for prior quarters.)
The second trend runs from 4Q2009 to current market represented by 2Q2011 numbers. At the beginning of this time, if you recall, Congress enacted a tax credit for new home buyers in order to stimulate the housing market. And as we witnessed, the stimulus did nothing but saturate the market with new home buyers who mostly pursued newly constructed homes with builder’s incentives and did very little to solve the underlying problems of the ills in the housing market: high inventories of foreclosures and unsold homes and more importantly, unemployment. As a result, builders rushed to complete new homes. With their insatiable demand for just-in-time lumber from sawmills carrying little inventory, builders drove lumber prices to a peak of $337/mbf in 2Q2010, up $90/mbf from 4Q2009’s price of $246/mbf. Subsequently as the credit expired in 2Q2010, so did the market for lumber and most experts will agree that all the credit did was prolong the market’s natural correction.
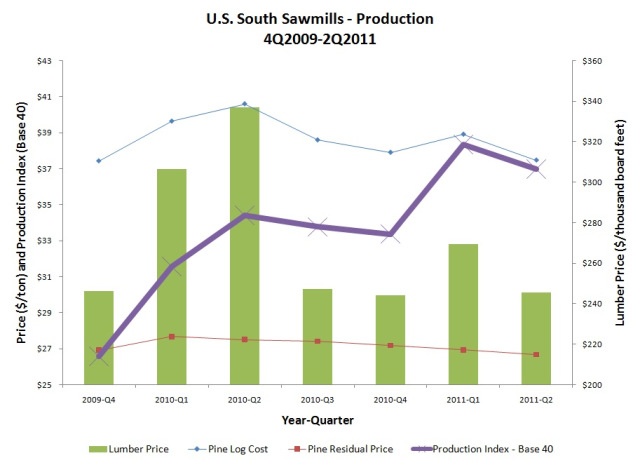
If we look closer at this time period (Figure 2), however, there is an interesting and perhaps disturbing trend that arises between lumber pricing and production. After the peak in 2Q2010 and the end of the credit, the market adjusted severely. Lumber prices quickly fell from their peak of $337/mbf to $247/mbf, only $1/mbf over 4Q2009’s level. However, the wild ride was in motion and there was no stopping it: production fell only 3% over the next two quarters and never came down to 4Q2009’s level. This is the worst part: a natural spike in the lumber market driven by real demand occurred in 1Q2011 as lumber prices climbed to $269/mbf; at the same time, production climbed by 15% quarter over quarter, flooding the market. Subsequently, with too much supply, lumber prices declined again in 2Q2011 to end at $245/mbf – right in-line with 4Q2009, 3Q2010, and 4Q2010’s prices.
Figure 2: Sawmill Activity 4Q2009-2Q2011
So what does this mean – are we at the end of the ride, facing the train and heading to that dreadful place no one wishes to go? Well, to me it means we have reached a bottom in the market and a new trend line to (pardon the pun) build upon. I believe we are poised to leave Mr. Toad behind and like Dante, climb out of this pit.
I say this because the dynamics over this period point to the $245/mbf average price for lumber, even with the heightened production. Also, log prices (which spiked over this same period) are back in-line with the 4Q2009 average. But most importantly, in the long run, we are forecasting that the housing market (though it will be flat this year) will reach 800,000 starts by the end of 2012. With this slowly evolving increase in housing starts, expect to see a slow, but gradual increase in lumber prices and the beginning of a recovery. The key will be whether sawmills reduce production back to 4Q2009’s just-in-time inventory levels. Gladly, I already see this reduction starting to occur in the 3Q2011 data. For those of you feeling nostalgic for Mr. Toad's Wild Ride: http://www.youtube.com/watch?v=j86Eb3toGIM.
Comments
08-29-2011
Anyone who can weave Mr Toad’s wild ride and Dantes Inferno into an economic descriptor of sawmilling in the South deserves a hand for writing an entertaining article when they could have cranked out another soporific paragragh. Thank you.
Comments
09-05-2011
already did, summary below…again
Lumber Futures Chicago Mercantile Exchange
I worked for a chartist at the Chicago Merc. I took Southern Pine prices and graphed
from 1965 for Basis Trading, Hedging, and Speculative positions.
Prices were low then, however rarely in the double digits per Thousand Board Feet.
However, if on considers a real dollar basis (or gold basis), we are at or near these
lower levels.
Let’s look at it another way 2005, versus Present 2011
Katrina CME Lumberfutures ContractHigh Price: November contract over $450/mbf
Irene CME Lumberfutures ContractLow Price: November contract near $220/mbf
darwinIam


 Daniel Stuber


