3 min read
Timberland Prices Rise and Fall, but Ultimately Return to Trend
Jay Engle : March 19, 2018

In June of 2011, Pete Stewart wrote one of Forest2Market’s most popular blog posts to date titled “Are $350 per Acre Timberland Prices around the Corner?” He had just returned from a beach vacation and the blog post focused on some of his observations about coastal housing prices and the trends he recalled over a period of years. He then drew a correlation between trends in coastal vacation properties and trends in timberland pricing, and he found a number of interesting similarities.
However, the economic theory that all pricing returns to trend line proved to be the most significant market dynamic that Pete observed in his comparison. While it is an important concept generally applied to commodity pricing, it can be applied to other pricing trends as well.
Pete’s blog post generated a great deal of interest; after all, a host of factors can affect timberland prices, including the productive potential of the soil, location, accessibility, species, volumes and many more. Yet, the concept is very intriguing, especially when considered in a broad, average-based assessment that can provide some level of instruction in trend analysis.
The initial post was written in a very different economic climate over six years ago, so we thought that it might be a good time to add another observation into the mix and reassess Pete’s premise with fresh data and perspective.
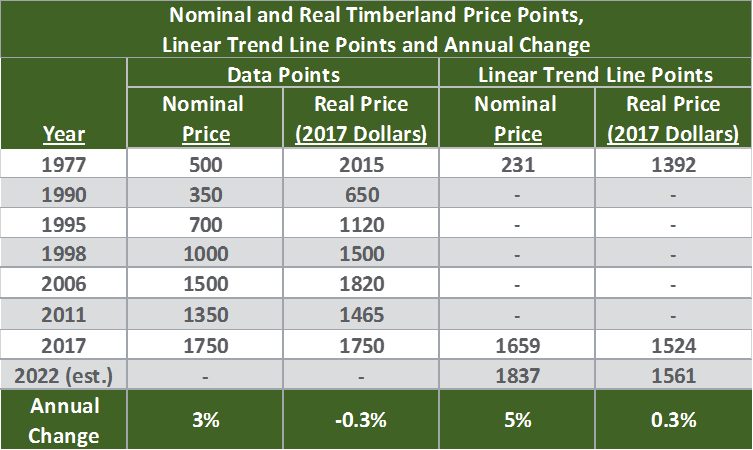
To that end, we started with information for timberland sales that occurred in 2017, and we developed an average to represent that year. Going back to Pete’s original blog post and adding the updated 2017 average gives us the following data points to look at in a trend line—this time from both an actual or nominal standpoint, as well as a CPI/inflation-adjusted look with all observations in 2017 dollar equivalents. In addition, the table below shows the beginning and ending trend line values based on the final (1977-2017) trend lines, and it includes the predicted 2022 prices. Finally, the last row contains the calculated annual changes associated with each price column.

For this update, we decided to use a different type of presentation by looking at the linear trend lines for different periods. We started with the trend line from the period 1977-1998 (four observations), then advanced to the next period 1977-2006 (five observations), and so forth. The following chart shows the actual data points and four period trend lines for nominal timberland prices.
 Figure 1 - Timberland Prices/Acre in the US South Over Time (Nominal)
As one would expect, the lines get closer together as more data points are added into the mix (more reliable data points are always positive). While it was somewhat surprising how quickly these points converged, a single year with a significant spike or drop could easily affect the graphical representation.
The following chart shows the effects of converting the observed prices into 2017, or real, equivalents.

Figure 2 - Timberland Prices/Acre in the US South Over Time (Real 2017 Dollars)
Does Timberland Price Return to Trend?
As one would expect, the addition of more data points brings the trend lines closer together in Figure 2, but not quite as tightly as did the nominal price chart. What really stands out, though, is the differences in the slope or pitch of the lines. In the nominal price chart, the slope is always in a positive or upward direction with an annual increase of about 3 percent for actuals and 5 percent for the trend line based on initial and ending values. However, in Figure 2, the trend lines all have a negative or downward slope except for the final (1977-2017) trend line, which is slightly positive.
How do we best interpret this data? At a fundamental level, the real price trend for timberland from 1977 to 2017 is almost flat, with an annual change of around -0.3 percent for the data points and +0.3 percent for the linear trend line based on the beginning (1977) and final (2017) values. This assessment is by no means meant to assert that there hasn’t been significant variance from the trend line; there definitely has been variance, but the overall movement over time is back toward a long-term trend.
I also marked the estimated 2022 values on both Figure 1 and Figure 2. In nominal terms, the estimated value is $1837/acre, while the real value estimate is $1561/acre. Are these estimates close? Only time will tell, of course.
As I noted above, this exercise was meant to provide a general overview about the direction of timberland prices and their tendency to return to trend; in that capacity, these prices should be realistic for averages. Do they represent an individual property, timber stand or even a localized area? No, and that was not the intent of this updated blog post. However, the data do suggest and reinforce the theory that timberland pricing does indeed return to trend.
If there are readers personally familiar with current timberland prices in a very broad sense, please feel free to comment on my estimated value, or share some insights from your own region. We’d like to hear from you, especially those who have worked in forestry for years and/or decades, or those with solid past timberland experience that we can draw from. We'd love to incorporate your insights into our next update.


