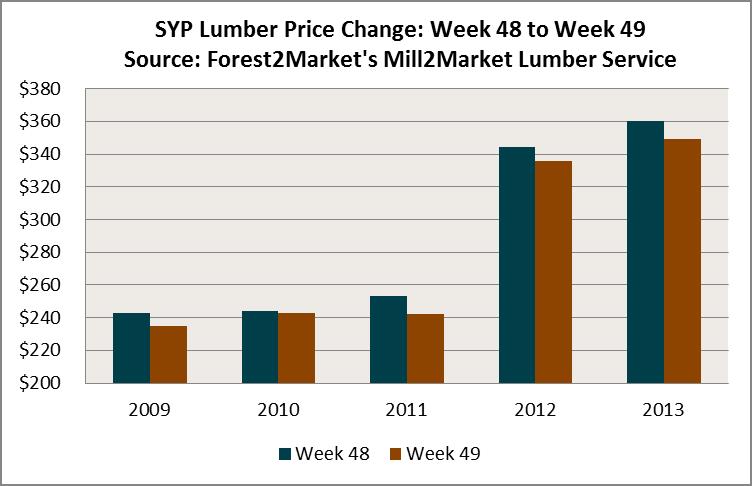

If you look at Week 49, you'll see that there has been a significant drop in lumber prices. This drop coincides with the fact that mills are moving inventory assets in order to strengthen their cash positions by the end of the year. (Week 49 is the last week an order can be taken and still be shipped and paid for by the end of the calendar year.)
This graph also shows a significant boost in market prices beginning in Week 50, as mills complete the purge of excess inventory and start bolstering their order files to meet expected demand during spring building season. This upward trend in prices continues through the first or second quarter of the following year.
Intrigued by this trend, we looked back at Weeks 48 and 49 in 2009 and 2010 (we began collecting data in 2009). The results show this trend is even more substantial. As the following graph shows, while the movement was more modest in 2010, the overall trend of a drop in price between Week 48 and 49 holds.

As this analysis shows, the level of detail in the data we collect can help us verify or debunk what those of us in the lumber business have commonly thought to be true. In this case, the data verifies industry observations.Look for more analysis from Forest2Market as 2014 trends begin to take shape.
Learn more about Mill2Market by visiting our website.
Request sample: Weekly Lumber Market Report and Quarterly Benchmark
Comments
01-06-2014
Why have stumpage prices in Texas/Arkansas/Louisiana not reflected the same strength as the MBF prices above?


