2 min read
Stumpage Market Trends in the US South: Harvest Type and Tons per Acre
 Daniel Stuber
:
February 27, 2015

This series focuses on the stumpage market trends we observed while analyzing the data collected in Forest2Market’s Timber Pricing Service from 2002-2014. This post--Part 3 in the series--highlights trend reversals in harvest types and yields.
- Part 1: Sale and Harvest Trends
- Part 2: Sale Method and Buyer Type
- Part 3: Harvest Type and Tons per Acre
- Part 4: Price
One of the most common questions we receive from landowners concerns harvest yield:
What is the average number of tons per harvested acre?
Our answer to this question—that it varies considerably—is dependent upon a range of factors:
- Forest type: plantation or natural
- Forest management plan, including plant spacing, silvicultural applications and thinnings
- Soil quality
- Type of harvest, final clearcut or thinning
A historical look at stumpage market trends since 2004 demonstrates exactly the relationship between the last of these factors, harvest type.
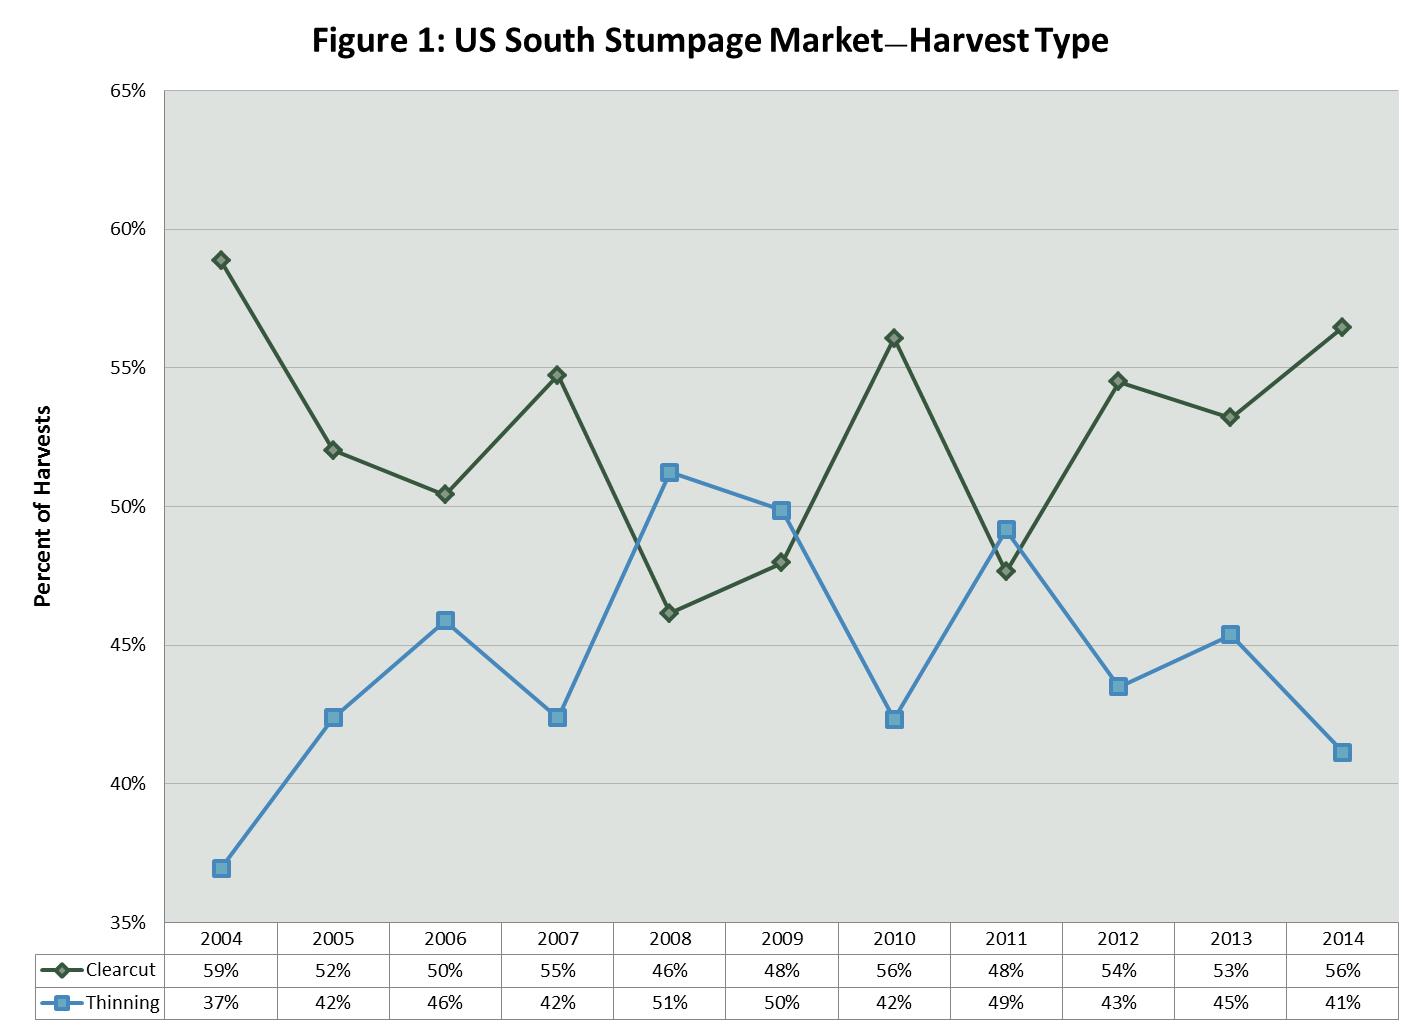
Prior to the sawtimber market decline, clearcuts were more common than thinnings. As the sawtimber market declined, however, clearcuts decreased as a percentage of the market and thinnings increased (Figure 1). By 2008, thinnings had trumped clearcuts as the most common type of harvest, with clearcuts making up 46% of all harvests and thinnings making up 51% (all other harvests = 3%). This pattern reversed briefly in 2010 because of the housing tax credit. In 2011, thinnings once again represented a larger percentage of the market. Beginning in 2012, though, harvest types reverted to their pre-recession trend, with the majority of harvests being clearcuts; the percentage has steadily increased since. In 2014, 56% of all harvests were clearcuts and 41% were thinnings.

Because of the changes in harvest type since 2002, the harvest yields have vacillated between 76 and 100 tons per acre. When thinnings are more prevalent, the average number of tons per acre decreases and when clearcuts are more common, this measure increases (Figure 2). In 2004, the average number of tons per harvested acre was 96. This fell to an average of 76 tons per acre in 2008, the market’s low point in the trend series. In 2010, again because of the home buyer tax credit, there was a slight uptick in tons per acre. Then, in 2012, as clearcuts became more prevalent, tons per acre began an upward trend. In 2014, the average increased to 100 tons per acre.

Interestingly, the average number of tons per acre increased above 2004 levels in 2014. In 2004, timber was harvested according to regular rotation schedules. Because sawtimber harvests were delayed during the recession, however, sawtimber that might have been harvested in 2009 or 2011 sat in the forest and continued to grow. As a result, the timber currently being harvested is larger than the timber typically harvested in 2004.


