2 min read
Southern Yellow Pine Exports to China on Pace to Double in 2018
 Daniel Stuber
:
November 12, 2018

According to trade data compiled by the US Census Bureau through August, 20181 exports of southern yellow pine (SYP) have increased nearly 1 million cubic meters (m3), or 73 percent, over 2017. If the trend holds, the US South will surpass the Pacific Northwest (PNW) on exports of conifer logs to China in 2018. Export prices2 (to all destinations) for Douglas fir have increased sharply and Hemlock prices have remained flat, but SYP prices have dropped significantly over the last year.
While exports of pine logs out of the US South are increasing, exports on an annualized basis in the PNW are trending down. Doug Fir exports continue a downward slide, dropping 3 percent since 2017 and 36 percent compared to 2014. Hemlock exports, which were up slightly in 2016 due to Chinese demand, are also on a 5-year slide; export volume is down 13 percent since 2017 and 43 percent compared to 2014.
Table 1 – Volume & Price of Select Log Exports (5 Years) 
Alternatively, SYP continues its upward trend driven by exports to China, gaining 28 percent in the conifer export market share since 2015. The increase in volume is driven by a significant decrease in price, as export SYP log prices are down 13 percent compared to 2017 and currently averaging $141/m3. This price decrease is a result of the plentiful log supply and availability of fast-growing SYP timber in the US South.
Table 2 – Percent of Total Export Volume (10 years)

Figure 1 - Price of Select Log Exports (5 Years)

Douglas Fir Destinations
- Japan continues to be the major importer of Doug Fir logs out of the PNW, but both Japan and China (particularly China) continue to decrease their import volumes year-over-year (YoY). However, South Korea is on pace to purchase 22 percent more volume this year.
Table 3 – Douglas Fir Export Volume by Destination (4 years)

Figure 2 - Douglas Fir Export Volume by Destination (4 years)

Hemlock Destinations
- China, Japan, South Korea and all other export destinations have all decreased purchases of Hem-fir out of the PNW in 2018 despite flat prices.
Table 4 – Hemlock Fir Export Volume by Destination (4 years)

Figure 3 – Hemlock Fir Export Volume by Destination (4 years)

SYP Destinations
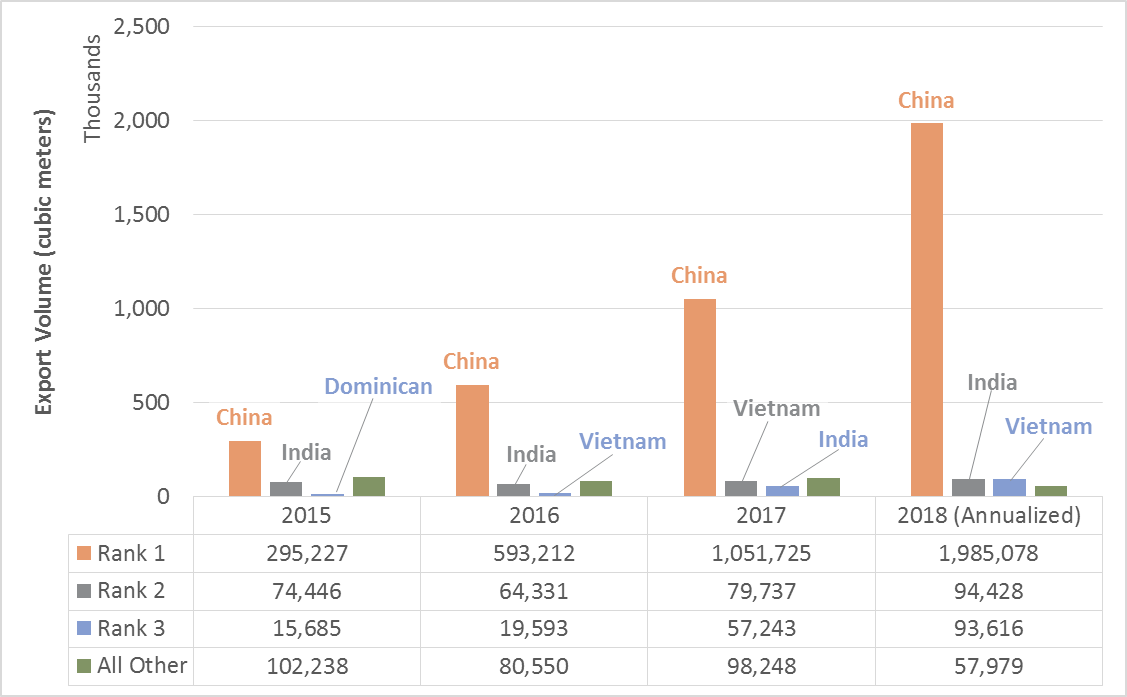
- China continues to purchase more SYP out of the US South; the country is on pace to increase its imports of SYP by 89 percent over last year’s purchases.
Table 5 – SYP Export Volume by Destination (4 years)

Figure 4 – SYP Export Volume by Destination (4 years)

The impact that some previously-enacted tariffs are having on the wood products trade between the two countries is just beginning to show up in the data. In late 2017, the US hit China’s plywood industry with significant countervailing duties. As the American Journal of Transportation recently noted, the tariffs totaled “nearly 200 percent on some imports of Chinese hardwood plywood after a Commerce Department analysis showed the engineered panels were being sold below cost of manufacture. Since the duties, China’s fiberboard exports to the U.S. fell 11% to 71,200 m3 and plywood exports to the U.S. dropped 31% to 360,000 m3 in the first three months of 2018.”
It’s still too early to tell how the escalating trade dispute and new round of tariffs between the US and China will play out.
[1] Based on U.S. Census Bureau district trade data for domestic exports of harmonized commodity codes: 4403200020, 4403200025, 4403200030, 4403200060 and 4403200065
[2] Prices are US dollars per cubic meter and are the Free Alongside Ship value at the port of export. It includes the transaction price, freight, insurance and any other charges in placing the logs alongside the carrier at the port of export. It excludes any cost of loading aboard the carrier, insurance and transportation beyond the port of export.
*Reflects actual data through August 2018 but includes estimates for September – December 2018.


