According to the Bureau of Economic Analysis, 3Q2011 GDP growth is currently being estimated at 2.5 percent. While upcoming revisions may move that needle somewhat, it is clearly better news for the economy than most—including Forest2Market—expected. A healthy housing market is generally responsible for about one-third of economic activity in the US. In the 3Q, consumer spending was in large part responsible for the advancement.
Mortgage Interest Rates
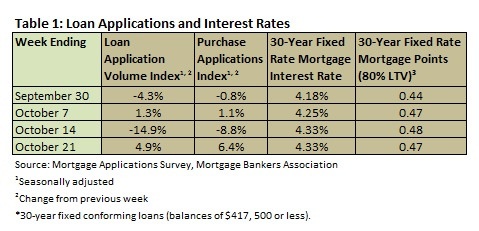
Mortgage interest rates moved even lower in September. Table 1 summarizes the results of the Mortgage Bankers Association’s weekly mortgage application survey. For the last two weeks a 30-year fixed conforming mortgage rate (loan balances of $417,500 or less) remained steady at 4.33 percent. Points are hovering under 0.5.
The Mortgage Bankers Association’s Chief Economist, Jay Brinkman, said this about interest rates: “We expect that mortgage rates are at or near their low points, but we have been wrong on this call before. Our rate forecast assumes that the Fed maintains short-term rates near zero for the next two years, and also assumes that mortgage-Treasury spreads remain wide, given the current supply and demand imbalance in the market. If the economy tips into recession, rates would stay lower for longer, but we do not anticipate they would drop significantly. If the economy recovers more quickly, even with the Fed’s Operation Twist, longer-term rates could rise faster.”
Construction
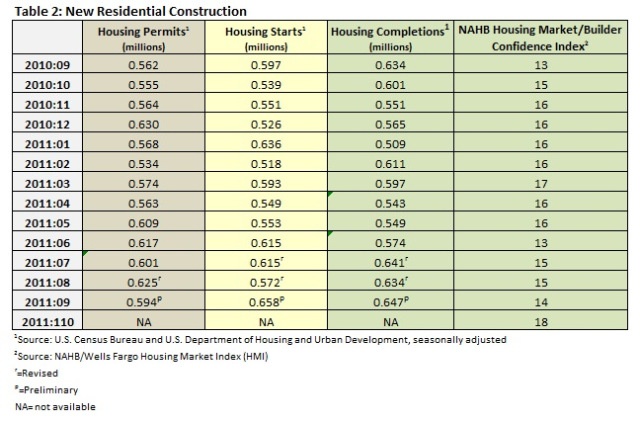
Table 2 summarizes the Census Bureau’s September new residential construction report. Starts climbed 15 percent month over month and 10.2 percent year over year. Permits fell by 5 percent month over month, however, though they were 5.7 percent above the September 2010 estimate. Completions increased by 2.1 percent; they were also 2.1 percent above August 2010’s level. Completions of single-family homes came in at 647,000 on an annualized basis suggesting continued imbalance, as sales of new homes totaled just 313,000 on an annualized basis (Table 3).
Builder confidence jumped 4 points to 18 (Table 2), according to the National Association of Home Builders (NAHB). This is the largest gain this index has experienced since the home buyer tax credit inflated the market in April 2010. While this improvement is remarkable by many standards, it should be noted that an index reading above 50 indicates more builders view conditions as positive rather than negative.
David Crowe, the NAHB’s chief economist, commented: “This latest boost in builder confidence is a good sign that some pockets of recovery are starting to emerge across the country as extremely favorable interest rates and prices catch consumers’ attention. However, it’s worth noting that while some builders have shifted their assessment of market conditions from ‘poor’ to ‘fair,’ relatively few have shifted their assessments from ‘fair’ to ‘good.’ One reason is that builders are facing downward pricing pressures from foreclosed homes at the same time that building materials costs are rising, and this is further squeezing already tight margins.”
Another NAHB indicator, the Improving Markets Index (IMI), isolates pockets of growth across the nation. In September, the IMI found 12 markets that have showed improvement for at least six months in three economic areas—housing permits, employment and housing prices. In October, that nearly doubled to 23. These markets include Alexandria, LA; Amarillo, TX; Anchorage, AK; Bangor, ME; Bismarck, ND; Casper, WY; Fairbanks, AK; Fayetteville, NC; Houma, LA; Iowa City, IA; Jonesboro, AR; Kankakee, IL; McAllen, TX; Midland, TX; New Orleans, LA; Odessa, TX; Pine Bluff, AR; Pittsburgh, PA; Sherman, TX; Sumter, SC; Waco, TX; Waterloo, IA; Wichita Falls, TX and Winston-Salem, NC. The report noted that energy and agriculture are the two primary economic drivers in these markets.
Home Sales
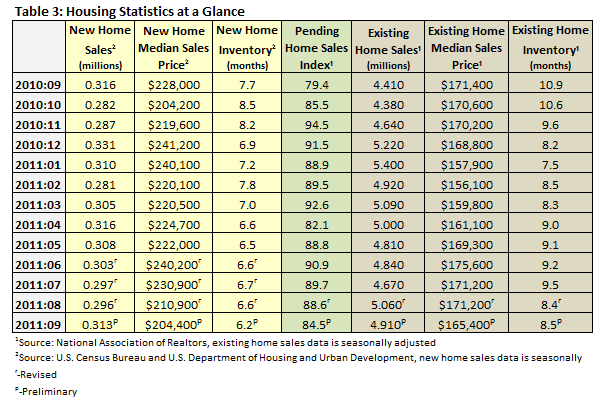
As for sales of new and existing homes in September (Table 3), new home sales were higher, 5.7 percent above August’s level but 0.9 percent below September 2010’s number. Sales of existing homes were down by 3.0 percent month over month, though 11.3 percent higher year over year. The pending home sales index fell by 4.6 percent; this is above the September 2010 mark by 6.4 percent.
In September, inventory of new homes stood at 6.2 months (down by 0.4 months from August, a 6.1 percent improvement); year over year, inventory has declined by 19.5 percent. Existing home inventories stood at 8.5 months, up 1.2 percent, though year over year inventory has improved by 22 percent. The pending home sales index in September fell by 4.6 percent, according to the National Association of Realtors.
Like interest rates, housing prices are still low, though the S&P/Case-Shiller Home Price Index reported that prices in both the 10 and 20-city indexes increased by 0.2 percent. According to David M. Blitzer, Chairman of the Index Committee at S&P Indices, “In the August data, the good news is continued improvement in the annual rates of change in home prices. In spring and summer’s seasonally strong period for housing demand, we cautioned that monthly increases in prices had to be paired with improvement in annual rates before anyone could declare that the market might be stabilizing. With 16 of 20 cities and both Composites seeing their annual rates of change improve in August, we see a modest glimmer of hope with these data. As of August 2011, the crisis low for the 10-City Composite was back in April 2009; whereas it was a more recent March 2011 for the 20-City Composite. Both are about 3.9% above their relative lows.”
Overall, the outlook for housing remains mixed. We have yet to see a strong directional pull one way or the other. Reports that creditworthy borrowers are having trouble getting loans, that deals are falling apart in midstream due to lending issues are becoming more common. If the economy continues to improve, however, as it did in the 3Q, we could see unemployment dropping below 9 percent by mid-2012, and this in turn could spur a more sustained uptick in housing.
Comments
10-28-2011
Suz-Anne, My question is: what kind of effect can a single housing boom have on the national market for wood in this environment of “mixed signals”, and if there is an effect, does it tend to be more-or-less uniform across all markets?
I see that Bismarck, ND is included on your list, which is in the Southwestern corner of the state. I attended a meeting this week regarding the boom in oil and gas development in the Williston Basin (includes Northern ND, Northeastern MT, and Southern parts of Alberta and Saskatchewan). A building boom is expected to follow the resource boom. They need workers, which are available now in almost over-abundance, but there is a serious permanent housing (houses and apartment developments) shortage, as well as as a shortage of commercial buildings leading to manpower retention issues.
There are similar smaller o&g booms occurring in other rural areas (let’s throw in also that the Southeast will become a major exporter of wood biomass to the EU also, just for fun).


 Suz-Anne Kinney


