New Residential Construction
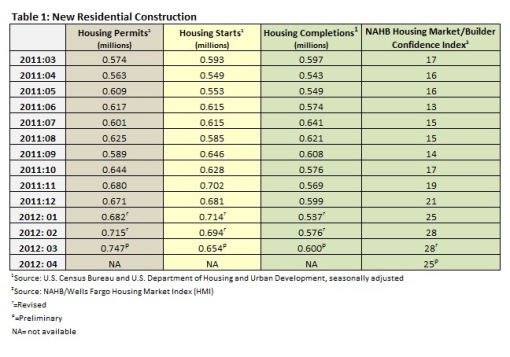
Table 1 summarizes the Census Bureau’s March new residential construction report. The number of housing starts fell from 694,000 to 654,000, or 5.8 percent. This represents an improvement of 10.3 percent over March 2011’s level, however. In the South, the number of starts declined as builders there worked on 16 percent fewer homes during the reporting period. The number of starts was stable in the West and higher by 33 percent in the Northeast and 1 percent in the Midwest.
The number of permits issued in March increased by 4.5 percent to 747,000. This is a stunning increase of 30.1 percent over the number of permits issued in March of 2011, and the highest level since September of 2008. The significance of this number increases when compared to March's forecast, which was 710,000.
Most of this month's strength was in multi-family units, which saw an increase 21 percent; single family units fell 3.5 percent.
Either home builders are overly cautious because of recent market conditions or signs during the early spring building season have not been as strong as expected: the builder confidence index fell 3 points to 25 in March after 5 straight months of improvement.
Two additional markets made the Improving Markets Index (IMI) list in March. The National Association of Home Builders’ IMI reported 101 markets showed improvement for at least six months in three economic areas—housing permits, employment and housing prices. The markets, now too many to list, can be found here.
Home Sales
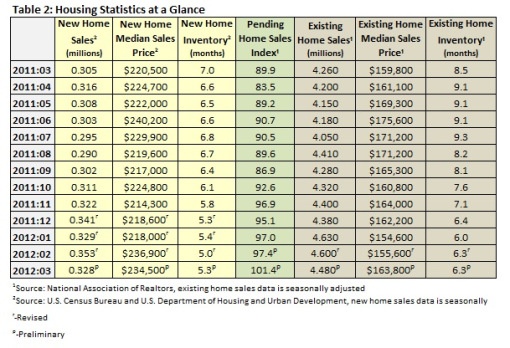
Table 2 shows sales of new and existing homes in March as well as the pending home sales index.
Sales of new single-family homes in March 2012 were at a seasonally adjusted annual rate of 328,000, 7.1 percent below the revised February rate of 353,000, according to estimates released jointly by the U.S. Census Bureau and the Department of Housing and Urban Development.
The seasonally adjusted estimate of new homes for sale at the end of March was 144,000, a supply of 5.3 months at the current sales rate.
“The March decline is from a stronger-than-expected sales pace in February, and looking at the first quarter as a whole, sales are up 3.7 percent from the fourth quarter of 2011,” noted NAHB Chief Economist David Crowe. “This is exactly the kind of modest, but substantive, growth that we are expecting to see in the year ahead along with gradual firming of the economy and job market.”
Regionally, new-home sales activity was mixed in March; the Northeast and South increased by 7.7 percent and 3.1 percent, respectively. In the Midwest and West, new home sales fell by 20 percent and 27 percent, respectively.
March sales of existing homes fell to 4,480,000 from a downwardly revised February rate of 4,600,000, according to the National Association of Realtors (NAR). This is a 2.6 percent decline from February and a 5.2 percent increase year over year.
Months of inventory remained stable at 6.3 percent at the current sales rate. February’s inventory was revised from 6.7 percent to 6.3 months. This is 25.9 percent above March 2011’s number of 8.5 months. At the end of the period, there were 2,370,000 existing homes on the market.
The Pending Home Sales Index, a forward-looking indicator based on contract signings, increased by 4.1 percent in March to 101.4—a 23-month high—from an upwardly revised number of 97.4 in February (originally 96.5). This is a 12.8 percent increase over March 2011’s 89.9 reading.
The Cost of Buying a Home
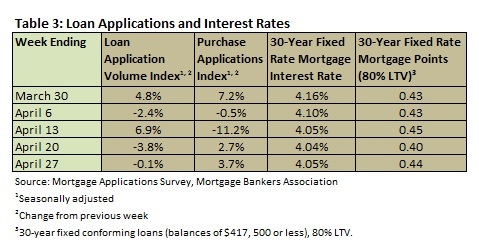
According to the Mortgage Bankers Association’s weekly mortgage application survey for the week ending April 27, the four-week moving average for the mortgage application index decreased by 0.09 percent. The four-week moving average for the Purchase Index increased by 1.77 percent.
Table 3 summarizes the weekly results of the MBA’s weekly mortgage application survey.
Mortgage interest rates fell in April. Throughout the month, the interest rate for a 30-year fixed conforming mortgage (loan balances of $417,500 or less) remained between 4.04 and 4.16 percent, with points varying from 0.40 to 0.44. Nonconforming loans (loan balances higher than $417,500) were roughly one-quarter of a point higher and FHA loans were roughly a quarter of a point lower.
Existing homes remain far more affordable than new ones. The median sales price of new homes sold in March was $234,500 (an increase of 6.3 percent over February 2011), and the median sales price of existing homes increased from a downwardly revised $155,600 in February, to $163,800 in March, an increase of 2.5 percent (Table 2).
The S&P/Case-Shiller Index (20-city composite) fell 3.5 percent in February, marking 6 straight months of decline. Prices dropped by 4 percent in January, however, so February does mark some improvement. In some cities, 12 of 20 cities in the 20-city composite, saw improvement; only 10 did so in January. In fact, some of the cities that were hardest hit by the housing market crash—including Phoenix and Miami—saw gains.
It is important to note that the Case-Shiller number is a three-month rolling index; it includes transactions that occurred from December to February. As a result, the Case-Shiller Index should most accurately be looked at as a lagging indicator of home prices, not one that accurately depicts contract prices right now.
Don Miller, a contributing writer for Money Morning, in “Case-Shiller Index: Is This the Housing Market Bottom?,” points out that foreclosures will continue to weigh the housing market down. This “explains why, in spite of better sales numbers, home prices continue to languish. Foreclosures tend to sell at a discount and because the Case-Shiller index includes sales of distressed properties, home prices reported by the index skew lower. . . . Although sales were up in February, foreclosure re-sales still made up about one-fifth of all sales."
Comments
05-08-2012
It is important to note that the Case-Shiller number is a three-month rolling index; it includes transactions that occurred from December to February…. is that true?
Comments
05-08-2012
Yes. The Case-Shiller Index is a three-month moving average published with a two-month lag.


 Suz-Anne Kinney


