Is the housing market improving? How you answer this question will likely depend on your location. In some places it is, and in others the turn toward improvement has yet to happen.
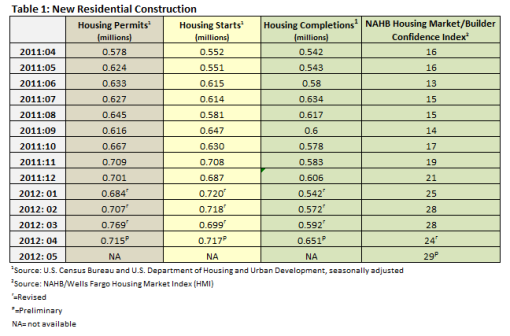
The number of housing starts rose in April from an upwardly revised 699,000 to 717,000, a 2.6 percent above March 2012 and 29.9 percent above the revised April 2011 rate of 552,000 (Table 1).
Single family housing starts increased 2.3 percent from March to 492,000 units. This is 18.8% above April 2011’s level, though this is 73 percent below the peak set in early 2006. Two of four regions had an increase in overall starts: an 11.6 percent gain in the South and a 6.7 percent gain in the Midwest. Both the Northeast and the West saw declines.
The number of permits issued fell from an upwardly revised 769,000 in March to 715,000 in April, a 7 percent decline. This is 23.7 percent above the number of permits issued in April of 2011.
After falling 4 points to 24 in March, the builder confidence index gained 5 points in April to 29. A rate above 50 indicates the market is healthy.
Home Sales
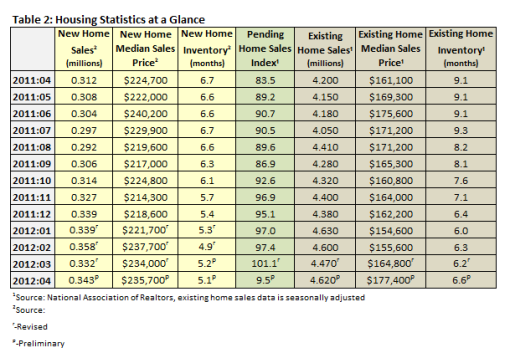
Table 2 shows sales of new and existing homes in April as well as the pending home sales index.
Sales of new single-family houses in April 2012 were at a seasonally adjusted annual rate of 343,000, 3.3 percent above the upwardly revised March rate of 332,000 and 9.9 percent above April 2011’s level, according to estimates released jointly by the U.S. Census Bureau and the Department of Housing and Urban Development.
The seasonally adjusted estimate of new houses for sale at the end of April was 146,000, a supply of 5.1 months at the current sales rate. The record high was recorded in January 2009 at 12.1 months.
Regionally, new-home sales increased by 7.7 percent in the Northeast, 28.2 percent in the Midwest and 27.5 percent in the West in April. The South was the only region to decline for the month: 10.6 percent.
April sales of existing homes increased 3.4 percent to 4,620,000, according to the National Association of Realtors (NAR). This is a 10 percent increase year over year. Months of inventory increased in April, however, up to 6.6 months at the current sales rate. This is 6.5 percent above March 2012’s number of 6.2 months, though 27.5 percent below April 2011’s 9.1 months of supply. At the end of the period, there were 2,540,000 existing homes on the market.
The Pending Home Sales Index, a forward-looking indicator based on contract signings, fell by 5.5 percent in April from 101.1 in March—a 23-month high—to 95.5. This is a 14.4 percent increase over April 2011’s 83.5 reading.
The Improving Markets Index (IMI) declined by one (from 101 to 100) in April. The National Association of Home Builders’ IMI tracks markets that show improvement for at least six months in three economic areas—housing permits, employment and housing prices. View a map of these markets on the NAHB website.
The Cost of Buying a Home
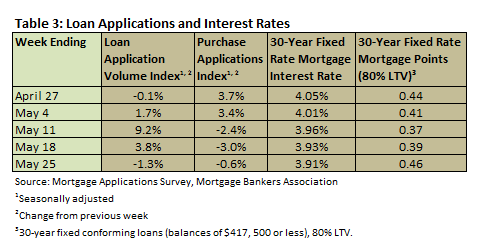
According to the Mortgage Bankers Association’s weekly mortgage application survey for the week ending May 25, the four-week moving average for the mortgage application index increased by 3.23 percent. The four-week moving average for the Purchase Index decreased by 0.67 percent. Table 3 summarizes the weekly results of the MBA’s weekly mortgage application survey.
Mortgage interest rates fell in May to the lowest level since the Mortgage Bankers Association began collecting data. Throughout the month, the interest rate for a 30-year fixed conforming mortgage (loan balances of $417,500 or less) remained between 3.91 and 4.05 percent, with points varying from 0.37 to 0.44.
Existing homes remain far more affordable than new ones. The median sales price of new houses sold in April was $235,700 (an increase of 0.7 percent over March 2012 and a 4.9 percent over April 2011), and the median sales price of existing homes increased from an upwardly revised $164,800 to $177,400, an increase of 7.6 percent over March 2012 and 10.1 percent over April 2011’s level (Table 2).
Other measures of home prices, including all three composite indexes reported by S&P/Case-Shiller, declined. The pace of declines seems to be slowing, however. The U.S. National Home Price Index, which covers all nine U.S. census divisions, posted a 1.9% decline in the first quarter of 2012 over the first quarter of 2011. In March 2012, the 10- and 20-City Composites recorded annual rates of decline of 2.8% and 2.6%, respectively.
“While there has been improvement in some regions, housing prices have not turned,” says David M. Blitzer, Chairman of the Index Committee at S&P Indices. “This month’s report saw all three composites and five cities hit new lows. However, with last month’s report nine cities hit new lows. Further, about half as many cities, seven, experienced falling prices this month compared to 16 last times.
“The National Composite fell by 2.0% in the first quarter alone, and is down 35.1% from its 2nd quarter 2006 peak, in addition to recording a new record low. The 10- and 20-City Composite mimic these results; also down about 35% from their relative peaks and hit new lows.
“There are some better numbers: Only three cities – Atlanta, Chicago and Detroit – saw annual rates of change worsen in March. The other 17 cities and both composites saw improvement in this statistic, even though most are still showing a negative trend. Moreover, there are now seven cities – Charlotte, Dallas, Denver, Detroit, Miami, Minneapolis and Phoenix – where the annual rates of change are positive. This is what we need for a sustained recovery; monthly increases coupled with improving annual rates of change. Once we see this on a broader level we will be able to say the market has turned around.
“The regions showed mixed results for March. Twelve of the cities saw average home prices rise in March over February, seven saw prices fall and one – Las Vegas – was flat. The Composites were largely unchanged with the 10-City down only 0.1% and the 20-City unchanged. After close to six consecutive months of price declines across most cities, this is relatively good news. We just need to see it happen in more of the cities and for many months in a row. Since we are entering a seasonal buying period, it becomes very important to look at both monthly and annual rates of change in home prices in order to understand the broader trend going forward.”
For a 2-year forecast of housing starts, subscribe to Forest2Market's Economic Outlook.


 Suz-Anne Kinney


