3 min read
Housing Market Data a Mixed Bag as Peak Season Comes to a Close
John Greene
:
September 22, 2016

The housing market held relatively steady as the summer months drew to a close. While August’s housing starts data was somewhat of a disappointment, other sector indices demonstrated more volatility. The market for new homes surged in recent months while existing home sales have demonstrated a slower, more stable performance despite uncertainty surrounding the upcoming elections and fears that any slight economic slowdown might curb market momentum.
Housing Starts, Completions & Permits
Housing starts dropped 5.8 percentage points to a seasonally adjusted annual rate (SAAR) of 1,142,000 units in August. Single-family starts accounted for 722,000 units, which is 6 percent below the revised July figure of 768,000.
Housing completions and permits also ticked downward in August. Completions were at a SAAR of 1,043,000, which is 3.4 percentage points below the revised July estimate of 1,080,000; permits were at a SAAR of 1,139,000, which is 0.4 percentage point below the revised July estimate of 1,144,000
Regional performance was spotty in August, as confirmed by the US Census Bureau report. Seasonally-adjusted housing starts by region included:
- Northeast: -13.8 percent; (+15.5 percent last month)
- South: -13.1 percent; (+3.5 percent last month)
- Midwest: +6.4 percent; (+2.3 percent last month)
- West: +6.3 percent; (-5.9 percent last month)
Housing starts in the South, which account for the bulk of home building, dropped to their lowest level since May, 2015. Economists said heavy flooding in Texas and Louisiana was driving this poor end-of-summer performance. "We believe that the slowdown in August starts likely owes to a temporary weather effect rather than a substantive shift in the underlying trend," said Rob Martin, an economist at Barclays. "Excluding the South, housing starts increased a robust 4.2 percent."
Builder Confidence
Home builder confidence surged in September to match its highest reading in a decade. The National Association of Home Builders’ (NAHB) index jumped six points to 65 in September, which was the highest since last October. “As household incomes rise, builders in many markets across the nation are reporting they are seeing more serious buyers, a positive sign that the housing market continues to move forward,” said NAHB Chairman Ed Brady. “The single-family market continues to make gradual gains and we expect this upward momentum will build throughout the remainder of the year and into 2017.”
Home Sales
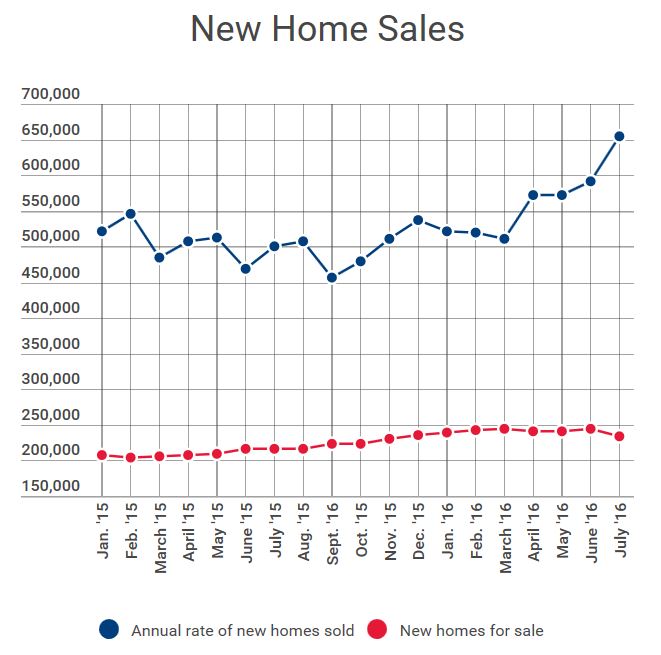
Based on the latest data (July), sales of newly-built homes rose to the highest level in nearly a decade. Purchases of new single-family homes rose 12.4 percent in July from a month earlier to a SAAR of 654,000, which was the highest level since October 2007. “New home sales soared again,” said Ralph McLaughlin, chief economist at Trulia, an online marketplace serving the real estate industry. “This is a continued sign that demand for new homes remains solid in a low interest rate, low unemployment environment.”
 Source: National Association of Home Builders
Sales of existing homes slipped during the same time period, decreasing 3.2 percent from a month earlier to a SAAR of 5.39 million. The decrease was the first since February. Some of the country’s most popular markets are showing early signs of slowing as buyers balk at rising prices. “You’re running out of customers,” noted Sam Khater, deputy chief economist at data company CoreLogic. “There’s a logjam: You’ve got first-time buyers who can’t buy, trade-up buyers who can’t move up, and it’s grinding to a halt.”
 Source: National Association of Home Builders
New and existing home inventory remained tight at 4.3 and 4.6 months, respectively. Both figures remain below the six-month supply considered balanced between supply and demand.
Home Prices
The pace of US home price gains slowed in June (the most recent data) from the month prior, but strong appreciation in the West and South kept growth above the two-year average. The S&P CoreLogic Case-Shiller 20-City Composite index rose 5.1 percent year-over-year versus expectations for an increase of 5.2 percent. That marked a slowdown from May's revised 5.3 percent increase. The gains were slightly above the 4.8 percent annual pace over the last two years.
Nationally, the median home price increased $17,000, from $223,000 in the first quarter to $240,000 in the second quarter. During the pre-recession housing bubble, prices rose because almost anyone could qualify for a mortgage and the subsequent demand sent prices skyrocketing. Now, lending is tighter but supply has failed to keep up with demand since the housing market recovery; total housing inventory at the end of July was 2.12 million homes, nearly 6 percent fewer than a year ago.
Mortgage Rates
The 30-year fixed mortgage rate remained unchanged in August at 3.44; this is 11 percent below the January 2016 rate, and is the lowest point it has been since January 2013. It remains to be seen if potential buyers, discouraged by limited supply and high rent prices, but encouraged by low interest rates through the summer, will return to the market as the buying season historically slows over the fall and winter months.
As noted above, regional data out of the South due to extreme weather likely skewed the numbers for August. Despite the pervasive sense of economic and political uncertainty as we exit the summer months, there is more to last month’s housing numbers than the data imply. McLaughlin continued, "While it's tempting to compare August housing starts to pre-recession peaks, homebuilders arguably built too many homes during this period. A better norm is the 50-year average, of which we're still about 20 percent below. While gains are slowing, the rising level of starts reflects a healthy combination of homebuilder confidence and sustained demand for homes during a time of solid job and income growth."


