This post is excerpted from Forest2Market's monthly Economic Outlook, a 24-month forecast of macroeconomic indicators.
Industrial Production
Industrial production (IP) rose by 0.6% in February after a 0.2% decrease in January. The report showed:
- Manufacturing increased by 0.8%, nearly reversing January’s 0.9% dip.
- Wood Products contracted by 1.2%, extending January’s 2.2% slide.
- Paper advanced 0.8%, reversing January’s 0.1% decrease.
- Construction edged up by 0.2%, partially offsetting January’s 0.3% loss.
- Consumer Goods jumped 0.8%, more than making up for January’s 0.5% drop.
Capacity utilization of all industries increased by 0.4% (to 78.8%). Wood Products fell by 1.4% while Paper rose by 0.9%. Capacity among all industries expanded by 0.2%; Wood Products edged up by 0.2% while Paper shrank by 0.1%.
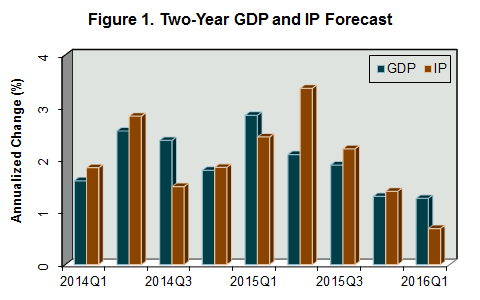
F2M forecasts that 1Q2014 IP will increase relative to 4Q2013 by an annualized rate of 1.8% (Figure 1). IP growth will subsequently fluctuate between 0.7% and 3.4% through the remainder of the forecast, averaging 2.0% overall.

Some upside potential exists for this forecast as there are early signals firms may finally be increasing capital spending, which could in turn translate into greater capacity and production. Several potential drivers behind the change in direction have been advanced.
We suspect firms’ past reluctance to invest was mainly driven by the overhang of capacity from the Great Recession and heightened uncertainty. But with capacity utilization now approaching pre-recession levels, capital project returns are beginning to look more compelling; cash is accessible and financing is still attractive.
Should these early signals on capital spending materialize, the main risk is whether or not consumer demand materializes to justify expanded production from increased capital spending. Favorable demographics aside, the key 20- to 29-year-old age cohort needs to have jobs and enough income to create demand for these products.
Manufacturing and Non-manufacturing
According to the Institute for Supply Management’s (ISM) monthly opinion survey, expansion of economic activity in the U.S. manufacturing sector inched up in March (Figure 2). The PMI registered 53.7%, an increase of 0.5 percentage point (50% is the breakpoint between contraction and expansion). ISM’s manufacturing survey represents under 10% of U.S. employment and about 20% of the overall economy. Expansion in the new- and backlogged-orders sub-indices (Table 3) suggest improving conditions; so, too, do continued growth in exports and imports. The new-orders sub-index correlates reasonably well to overall economic activity.

Among the industries we track, Wood Products contracted in March, as increased export orders were overwhelmed by a drop in new orders and production. Paper Products grew, with widespread support among the sub-indices.
The non-manufacturing sector, which accounts for 80% of the economy and 90% of employment, recovered some of the ground lost in February (Figure 2). The NMI registered 53.1%, an increase of 1.5 percentage points. The New Orders sub-index improved; that sub-index correlates well with overall economic conditions.
Among the individual service industries we track, Real Estate contracted on weak employment in March. Construction expanded on the strength of new orders, imports and employment. Increased new orders and imports also boosted activity in Ag & Forestry.


