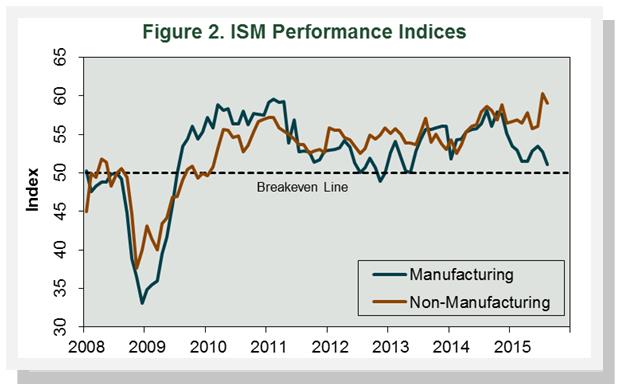
Forestry-related industry performance in both the manufacturing and non-manufacturing sectors for the latter part of July and August followed the relatively flat trend that it has maintained for most of 2015.
Total industrial production (IP) rose 0.6% in July (+0.4% was expected), besting June’s +0.1% increase. In July, manufacturing output advanced 0.8% primarily because of a 10.6% increase in motor vehicles and parts. The index for mining rose 0.2%, while utilities fell 1.0%. At 107.5% of its 2012 average, total IP in July was 1.3% above its year-earlier level. Wood Products and Paper output rose by 1.4% (-2.3% YoY) and 1.0% (-0.1% YoY), respectively.
Capacity at the all-industries and manufacturing levels moved higher—all-industries: +0.1% (+1.7% YoY) to 137.8% of 2012 output; manufacturing: +0.1% (+1.2% YoY) to 138.4%.
- Wood products rose +0.2% (+2.4% YoY) to 159.2%
- Paper was unchanged (-0.9% YoY) at 116.9%.
Capacity utilization (CU) for the industrial sector increased 0.4% in July (-0.4% YoY) to 78.0%, which is below the threshold (82-85%) that some consider conducive to price inflation.
- Wood Products CU increased by 1.2% (-4.7% YoY) to 68.3%
- Paper rose by 1.0% (+0.8% YoY) to 83.2%
Manufacturing and Non-manufacturing Surveys
The Institute for Supply Management’s (ISM) monthly opinion survey again showed decelerating growth of activity in the U.S. manufacturing sector during August (Figure 2). The PMI fell 1.6 percentage points, to 51.1%—its slowest rate since May 2013 (50% is the breakpoint between contraction and expansion). Wood Products was unchanged in August, and Paper Products continued to expand.

The pace of growth in the non-manufacturing sector eased off its July high. The NMI dropped 1.3 percentage points to 59.0%. Two of the three service industries we track (Real Estate and Construction) reported expansion in August.


 Joe Clark


