2 min read
Correlating Rainfall & Timber Prices: What Does the Data Say?
John Greene
:
March 25, 2019

Performing routine and detailed precipitation analyses can be a good additional way to monitor the directional price of timber products in a specific wood basin. While precipitation data is not a substitute for a comprehensive price forecast, which accounts for the macro and microeconomic indicators that will also affect regional prices, it does address the “accessibility” factor that impacts harvest levels in many instances, and can therefore be used to gauge the feasibility of harvests over a period of time.
Forest2Market’s new precipitation tool, available to SilvaStat360 subscribers, covers the four primary wood baskets in the US, includes precipitation data that is updated monthly and allows users to filter by date, region, state and county to get an accurate and granular view of precipitation trends over time. What trends can we glean from a current, monthly snapshot of precipitation data in the US South?
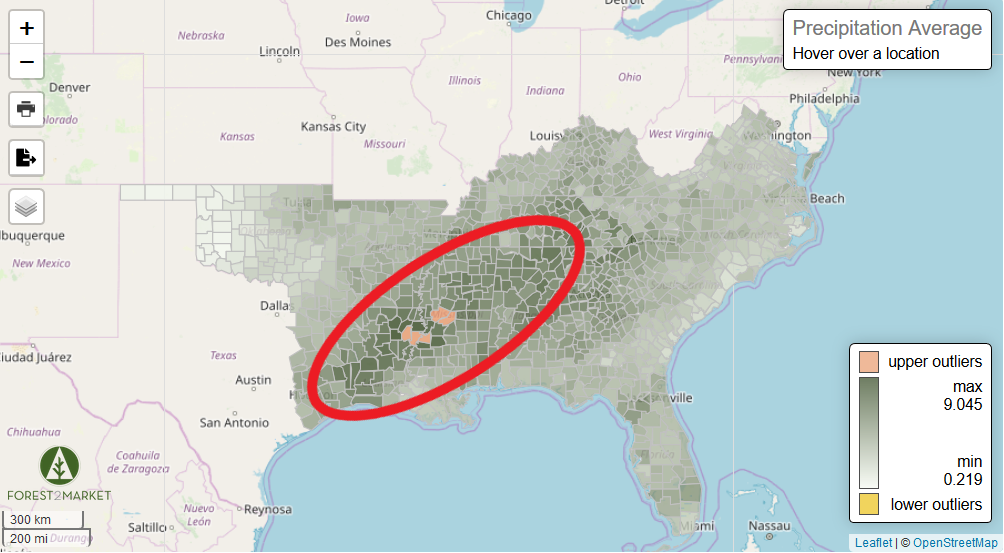
Most of the South received above normal rainfall through 3Q and 4Q2018 due in part to two major hurricanes that made landfall in North Carolina and Florida, and the deluges have yet to recede. While February data is not yet finalized (it, too, was a wet month), the data for January confirms the higher-than-normal rainfall trend throughout the South as visualized using the precipitation tool in SilvaStat360. When looking at the map below, we also see a well-defined zone (within the red circle) of very high precipitation that stretches from southwest Louisiana towards the northeast and into Mississippi and portions of Alabama.

Narrowing the focus a bit, there was a cluster of 42 counties within the red circle that were shaded as being in the “max” and “upper outlier” categories, which covered a swath in portions of both Louisiana and Mississippi. Looking at a three-month period from November through January provides a snapshot of the trend over a short timeframe as illustrated in the map below.

From the data in the following chart, we can see that the entire 42-county area received a monthly average of 7.7” of rainfall from November 2018 through January 2019, which is 64% higher than its 10-year average. During the same time period of the prior year, the study area received just 3.1” of rainfall, which is 34% below its 10-year average.

Of these 42 counties, Ouachita, LA received the highest amount of rainfall from November 2018 through January 2019 (28.4”), and Humphreys, MS received the least amount of rainfall (18.0”).

A considerable amount of rainfall on top of an already-wet few months can impede harvesting activities, which affects market prices for timber. Can we apply this correlation to the 42-county study area and if so, can we then confirm the directional price of timber products in the region as a result? Using Forest2Market’s new Stumpage360 tool, users can sort and filter down to the county level and then further filter by date, product, acres, buyer/seller types, harvest types and other important criteria. This tool was used to get an accurate view of pricing trends over time.
The weighted price-per-ton of all timber products in the region increased over 76% in the three-month period from November 2018 through January 2019. This represents a significant surge compared to an equivalent number of sales in the same time period during the prior year, when prices increased just 6%. (Prices for individual products will vary and demonstrate more/less volatility; Stumpage360 users can analyze all these price dynamics by product type.)


Historically, timber prices in the US South recede when the hot and dry summer months approach and harvesting activities can continue largely unabated. While it’s important to note that a variety of factors impact stumpage prices in the South—including competition, inventory levels, tract size and tree size/quality—excessively wet weather is a deal breaker. There are simply no guarantees with the weather, so short- and long-term timber price forecasts must account for some degree of variability.
Analyzing current and historical precipitation and actual stumpage price datasets can be an effective way of gauging the direction of the market and preparing for impending price fluctuations. Performing this kind of detailed analysis on a regular basis can provide measurable advantages and boost profitability for participants in the forest value chain.


