In August 2011, the US Department of Energy (DOE) released an update (2011 BTSU) of the 2005 Billion Ton Study (2005 BTS). The purpose of the original study was to determine if agricultural and forest resources could displace 30 percent of the country’s petroleum consumption, which the DOE estimated would take one billion dry tons of biomass annually. Because the original study did not take into account what biomass was practically and economically available, many criticized the study’s conclusions.
With this update of the study, the DOE attempts to address these criticisms by including:
- “A spatial, county-by-county inventory of primary feedstocks"
- “Price and available quantities (e.g., supply curves) for the individual feedstocks"
- “A more rigorous treatment and modeling of resource sustainability”
Total Biomass Availability
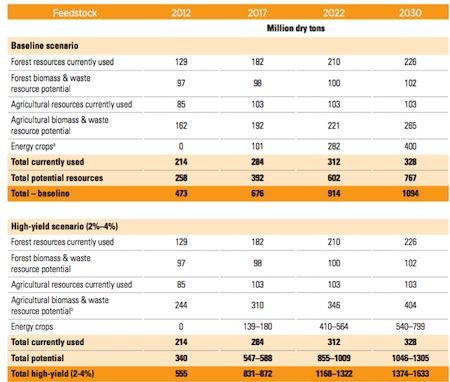
Using these new parameters, the study reached the following conclusions (Table ES.1: 2011 BTSU):
Table ES.1: Summary of Currently Used and Potential Forest and Agricultural Biomass at $60 per Dry Ton or Less under Baseline and High-Yield Scenario Assumptions
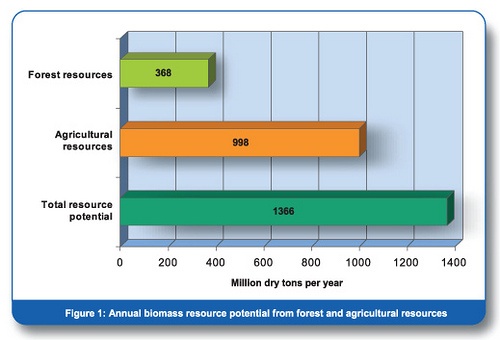
Under the base demand scenario, the new study still finds that one billion tons of biomass will be available in 2030 (though significantly less prior to then). In the high-yield scenario (which increases the yield of energy crops by 2-4% every year), the figure climbs to 1374-1633 million dry tons per year. Compare these numbers to those in the original study, which estimated the total resource potential at 1366 million dry tons per year (Figure 1: 2005 BTS—Total 2005 BTS).
Because it looks at available supply by price point and time frame, the updated study clearly demonstrates a more complex understanding of potential biomass supply. The updated study also breaks energy crops out into a separate category. While estimates of both forest and agricultural biomass have decreased in the updated study, energy crops more than make up for the deficit.
Forest Biomass Availability
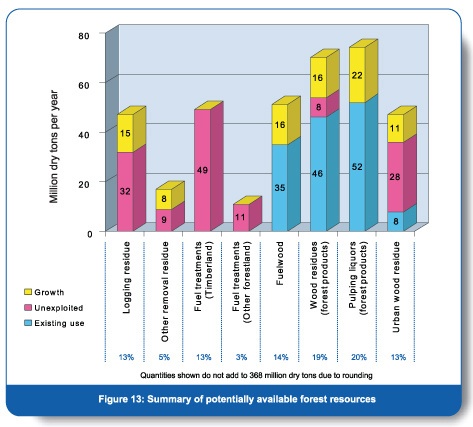
In the 2005 study, the annual forestry-related biomass was estimated to be 368 million dry tons (736 million green tons) per year, 142 million tons that were already being consumed and 226 million tons that were potentially recoverable over and above the 142 million tons (see the breakdown in Figure 13: 2005 BTS).
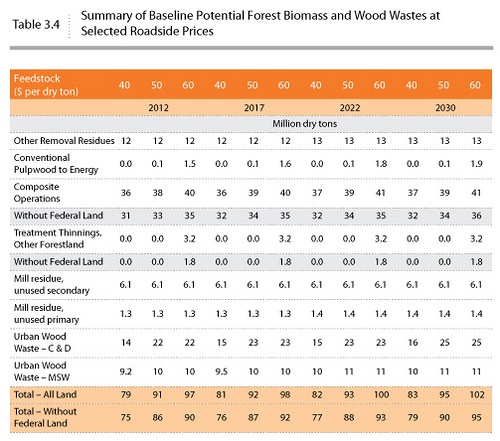
In the 2011 update, the total amount of forestry-related biomass has been reduced to 328 million dry tons (656 million green tons) per year, 226 million of which are already consumed and 102 million tons that are potentially recoverable (see breakdown in Table 3.4: 2011 BTSU).
The following table summarizes the differences between the two studies:
Comparison of Forest Biomass Resources in 2005 BTS and 2011 BTSU
What factors account for the 124 million ton difference between the additional potential forest biomass resources identified in the two studies?
One difference—though this is not necessarily apparent from the numbers—is the list of biomass materials. The original study included the following types of biomass:
- Forest residues
- Fuel treatment removals
- Roundwood (smaller than pulpwood) converted for energy production
- Forest product industry residues and urban wood residues
- Forest growth and the increase in demand for forest products
The list of materials included in the tally for the 2011 Update provides a more accurate view of what is available for energy production:
- Logging residues and thinnings
- Other removal residues (from conversion of forestland for development and other purposes)
- Forest residue thinnings from other forestland (land that is not commercially productive)
- Fuelwood, mill residues and pulping liquors
- Urban wood wastes
- Conventionally sourced roundwood pulpwood
The two signficant differences between these two lists are:
- An overestimation in the original study of the amount of forest biomass that would be available based on the assumption that the housing market (at its peak in 2005) would continue to spur demand for forest products. Because of the recession, this trend has reversed. Lower sawtimber harvest levels also result in lower volumes of logging residues being available.
- The inclusion of conventionally sourced pulpwood in the 2011 Update.
Another reason that the potential available biomass decreased from study to study is that the DOE applied sustainability screens to two classes of biomass in the later study:
- For the update, the DOE assumed 30 percent of logging residue volume needs to be left on site in order to ensure forest health and sustainability; as a result, they count just 70 percent of this material.
- While the inclusion of conventionally sourced pulpwood made up for some of the decreases discussed above, the DOE applied the industry standard measure of sustainability to this pulpwood, including only that volume of pulpwood equal to the amount of forest growth in any given year.
Ultimately--despite the differences--the 2011 Update reached the same conclusions as the earlier study: between forest and agricultural resources, sufficient feedstock exists to potentially displace at least 30 percent of the US’s current petroleum consumption. The report makes it clear, however, that “the feedstock potential identified . . . could be realized, assuming an increased investment in research undertaken by the state or private interests, not only in crop yields, but in new innovative management and production systems, harvesting and collection technology, and the science of sustainable management.”
Comments
10-03-2011
1, Always put the positives and the summary of the report first. There is no Summary of the report in this whole article.
2. This is a report of the data that was fed into a study. It’s not a report that any potential landowner would want to read.
3. You can list the negatives at the end, if they are valid. If not, then leave it out.
4. This article rambles from one subject to another. That’s poor structure.
Sorry for the criticism but these articles are almost a waste of reading time.
Comments
10-03-2011
No need to apologize for the criticism, Glenn. I was a writing teacher for 14 years, and if there is one thing I believe it’s this: if you dish it out, you’ve got to be able to take it.
I appreciate the fact that you took the time to read the article carefully. You are correct that I do not offer a summary of the entire report. As all of our subscribers operate somewhere in the forest supply chain (from the forest to the market, as our name suggests), my intent was to focus on forest resources only, and to compare the assessment of available forest resources in the 2011 update of the Billion Ton Study to those identified in the 2005 original study. I intentionally did not cover the agriculture piece, as that is outside the scope of my expertise. Further, my goal was to try to identify the reasons for the differences in the volume of forest resources available.
Clearly, I could have made that intent clearer in the title or in the first paragraph (or both)—something I won’t forget in the future now that you’ve pointed out my oversight.
As for the negatives, my point was to highlight the fact that the update of the study (which was criticized widely in the industry when it was first released) has gone a long way in clearing up the issues that were identified in the early years after the study’s release. I think the DOE’s methodology in the second study is much stronger this time around and therefore much closer to accurate.
Again, Glenn, I appreciate the fact that you’re reading my posts critically, and I apologize that my lack of a clear thesis statement and vague title made that difficult.
Comments
A Closer Look at the Billion Ton Study Update | Fo
10-10-2011
[...] Look at the Billion Ton Study Update October 10, 2011 - 0 Comments By Suz-Anne Kinney – Forest2Market Watch Photo by Biomass [...]


 Suz-Anne Kinney


