2 min read
Carbon Benchmarking: A Key Metric for Improving Environmental & Economic Returns
Fisher International
:
September 28, 2020

This post originally appeared on Fisher International's FI Blog.
A global desire for advanced energy and consumer products derived from sustainable, renewable resources is driving new trends in the marketplace. Modern consumers are increasingly concerned about the implications of climate change and are demanding increased alignment between corporate, civic, and environmental goals that provide meaningful environmental outcomes.
The paper industry’s contribution to global emissions has attracted the attention of society and governments. Using a “cradle-to-gate” metric, the paper industry emits just over half a billion tons of greenhouse gases (GHG), which is large enough to create a significant financial impact across the industry.
The disparity in carbon footprints of different mill facilities and the responses different countries maintain toward GHG emissions have the potential to dramatically change the competitive positions of paper producers. Because the financial impact of carbon is so uneven, we can expect the effects of the carbon and sustainability issues to vary greatly between organizations. It is particularly important for owners and their stakeholders to understand the relative position of each of their assets compared to their peers.
How do industry participants know where they stand against their peers? Could they drastically cut their emissions? Improve operating costs?
Fisher International’s BI platform, FisherSolve Next (FSN), provides a comprehensive analysis of carbon emissions that is unique to the pulp and paper industry. Fisher’s Carbon Benchmarking database can be used by the pulp and paper industry for both policy considerations and commercial purposes, and it supports analysis of carbon emissions at both mill and macro levels with standardized measures and consistent methodology for the global industry. Unique features of the module include:
- Each mill’s carbon emissions using commonly-accepted carbon methodology and Fisher’s sophisticated mass-energy balance mill modeling system
- “Cradle-to-gate” scope with a breakdown of emissions by source
- Global coverage of every mill in the world making 50+ TPD
- Powerful benchmarking software for asset comparisons and analysis
- Integrated with FisherSolve™ mill asset and cost data for rich analysis by grade, region, type of equipment, and hundreds of other factors
- Updated every quarter
Two announcements by major industry players regarding site improvements that will impact decarbonization strategies have recently made headlines, and Fisher’s Carbon Benchmarking data illustrated the discrepancy in performance and correctly predicted the upgrades.
- International Paper Co. announced it will invest $175 million during the next 10 years in its Eastover, SC mill. The investment will support cost efficiency as well as environmental and maintenance initiatives. The plant manufactures uncoated freesheet paper and pulp that is converted into products used for education, communication, and personal hygiene.
FisherSolve data for the Eastover site shows it is a low-risk mill among uncoated freesheet mills in North America. The Eastover facility emits the highest amount of carbon in its peer group, though there are several mills that also perform significantly below the average range.

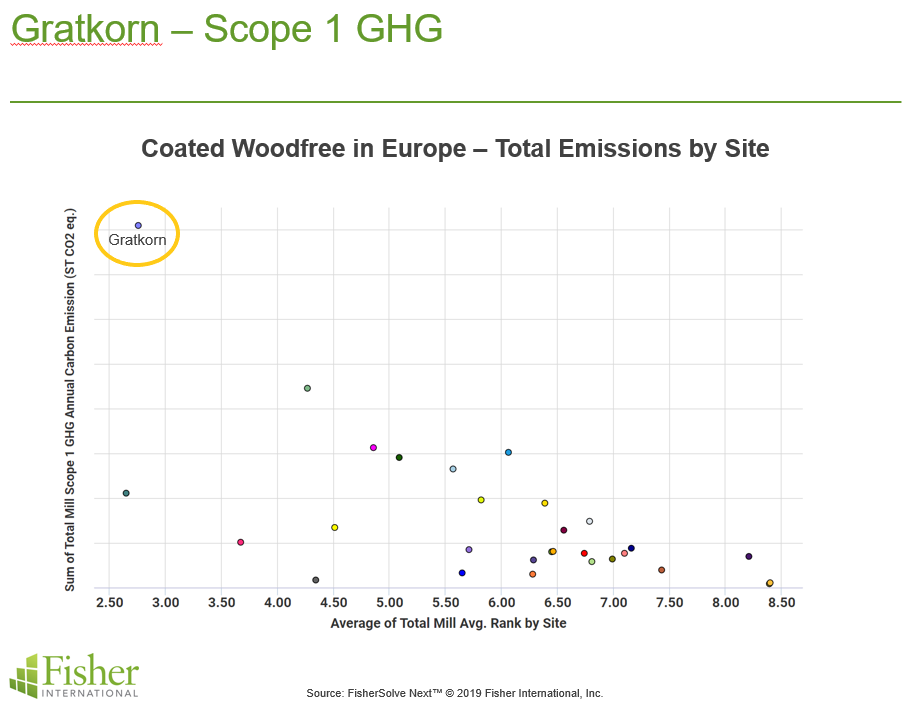
- Sappi announced a complete overhaul of boiler 11 at the Sappi Europe Gratkorn production site in Austria. This investment into state-of-the-art technology will see a shift from a coal boiler to a new boiler that will use only sustainable and renewable fuels. The move will allow the Gratkorn mill to reduce its CO2 emissions by 30%, and the rebuild is expected to be complete in late 2021.
Likewise, FisherSolve data demonstrates that Gratkorn is a low-risk mill with enormous annual carbon (and also per-ton) emissions among coated woodfree producers in Europe. The facility emits the highest quantity of carbon in its peer group by a longshot; its closest peer emits significantly less carbon annually.

As in the case of individual mills, there is a substantial difference in the carbon outputs between companies. The average of the fourth quartile emits roughly 2.25 times the carbon as the average of the first quartile. Even within grades and regions, there are big differences between companies with fourth quartiles averaging twice that of first quartiles in most cases.
Participants in the global pulp and paper industry now have a way to evaluate their carbon emissions completely and comprehensively. Fisher’s Carbon Benchmarking is already being used by producers, suppliers, and regulators for GHG-related analysis, which provides increased transparency into this topic—one that will become increasingly critical as sustainability initiatives continue to shape markets.


