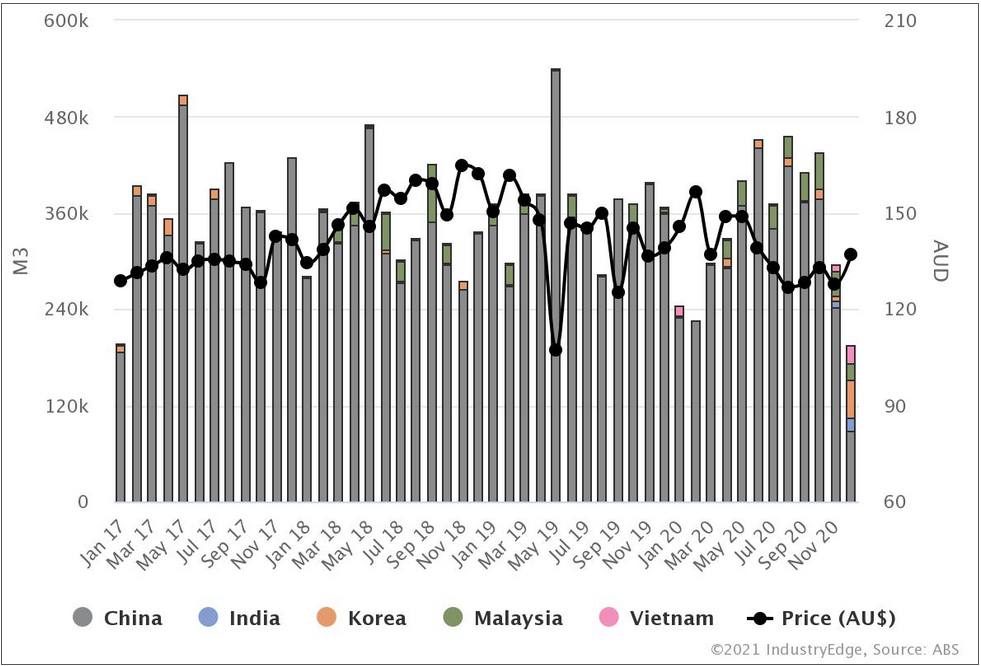
IndustryEdge advises that Australia’s log exports fell to a five-year low in December 2020, down 47% on the prior December and totaling just 196,519 cubic meters (m3). The dramatic fall saw exports 34% lower than for November, which was itself 32% lower than exports in October.
The average export price for December was AUDFob140.14/m3, up from AUDFob130.49/m3 recorded the prior month.
All of the trade data for December 2020 – for all forestry and wood products imports and exports – has been uploaded to IndustryEdge’s visualization platform, Wood Market Edge online, where the following chart was created. Subscribers can login here, interrogate the data in detail and download raw data files and charts.
Australian Log Exports by Main Country: Jan ’17 – Dec ’20 (‘000 m3 & AUDFob/m3)

The sole driver for the steep decline in exports was import bans imposed by China, on shipments from Australia. Observably, other countries stepped into the breach, but were unable to come close to covering the significant fall in shipments to China.
This chart shows Australia’s log exports to China alone over the same time period. What it emphasizes above all elder, is the significance of China to the log export trade. Notably, the recent experience contrasts with that for New Zealand.
Australian Log Exports to China: Jan ’17 – Dec ’20 (‘000 m3 & AUDFob/m3)

Wood Market Edge online subscribers have the ability to interrogate the detailed data for all of New Zealand and Australia’s imports, exports and significant consumption of wood products, as well as keeping up to date with IndustryEdge’s leading analysis and ongoing market commentary.
The Future Needn't Be Frightening
Using a mix of trade data, automated vessel tracking, port “watching” and ongoing field research, Wood Market Edge online allows subscribers to understand what is happening in global trade today and predict what will occur in coming months.
The group of datasets available on the Wood Market Edge online platform delivers intelligence that is literally months ahead of the formal release of trade data, because in almost real-time, it links vessel movements at the ‘port-to-port’ level.
- Visual mapping of wood products trade flows between countries
- Detailed data displaying total demand for sawnwood on an ongoing basis
- Automatic charting based on user selections
- Powerful data visualizations providing instant insights into global trade flows
- Custom downloads of data and charts, and ongoing access to complete data files


 Tim Woods


