
SYP lumber prices have held somewhat steady across 2023 thus far. Price variance is far below the meteoric rises and falls of 2022 and 2021. Some slowing down of contraction within housing and manufacturing has likely played a role in this steadier-paced pricing.
SYP Sees Much More Stable Levels
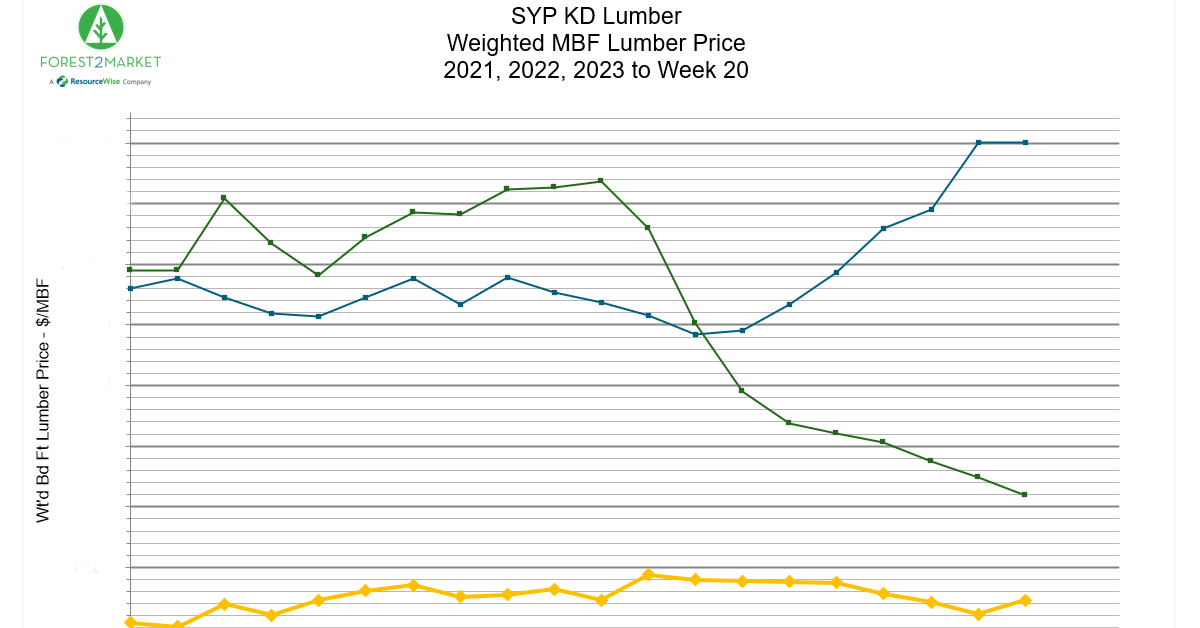
Weighted MBF SYP lumber prices have posted within a $100 range throughout the year so far. The start of 2023 had lows not seen since pre-pandemic times in 2020. However, the variance between amounts is nowhere near the incredible volatility we saw in the preceding two years.
Here is how 2023 has looked so far:

Compare 2023 numbers to the same period in 2022 and 2021:

As the charts show, the unstable and unpredictable pricing which dominated the market in the last 2 years seems to have settled down. For instance, 2022 saw a nearly 200% drop in price from the absolute high (pictured here) to the low just 8 weeks later.
With stabilized lumber pricing thus far in 2023, many other key economic indicators are suggesting a similar calming effect.
Housing Report: Less-than-Expected Drop After February Surge
February’s surprise surge in housing starts and permits was driven largely by a brief dip in mortgage rates. As a result, March data was expected to slide—and it did.
The good news is that although housing starts fell, the drop was less than expected at -3.5% (‑0.8% month-over-month). Building permits stumbled more noticeably at -8.8% MoM versus -5.4% expected after February’s revised increase of +15.8%.

Expectations surrounding resales included a modest pullback. With February as the outlier, March numbers reflect the thirteenth monthly retreat of the last 14 months. It leaves existing home sales down more than 21% year-over-year.
Thanks to February’s numbers, the Census Bureau reported sales soared 9.6% in March to their highest level since March 2022. Since mortgage rates rose in March, liberal use of homebuilder incentives is a reasonable explanation for the heightened sales pace.
While this is mostly optimistic news, analysts say that affordability remains an issue. With prices and interest high and supply low, we’ll likely see tougher credit standards for borrowers.
Overall, we forecast total starts in 2023 to fluctuate to a -14.4% average relative to 2022. 2024 numbers will hit a +4.7% increase from 2023, and January-April 2025 levels will keep rising to +10.8% YTD from the year prior.
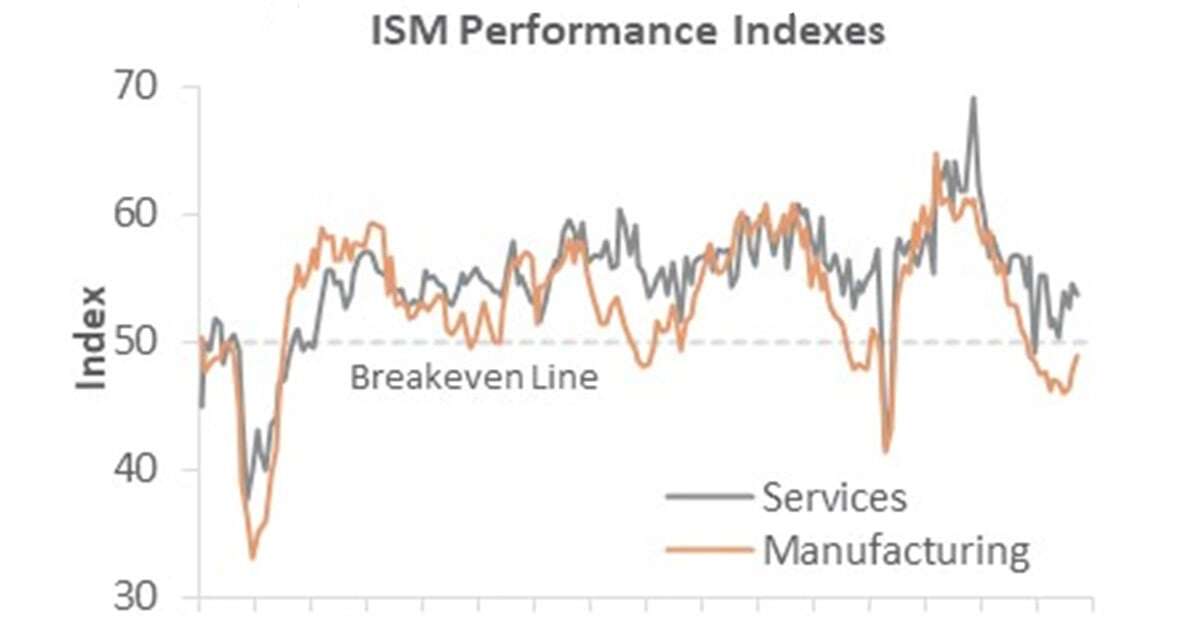
Manufacturing Constriction Slowing Down
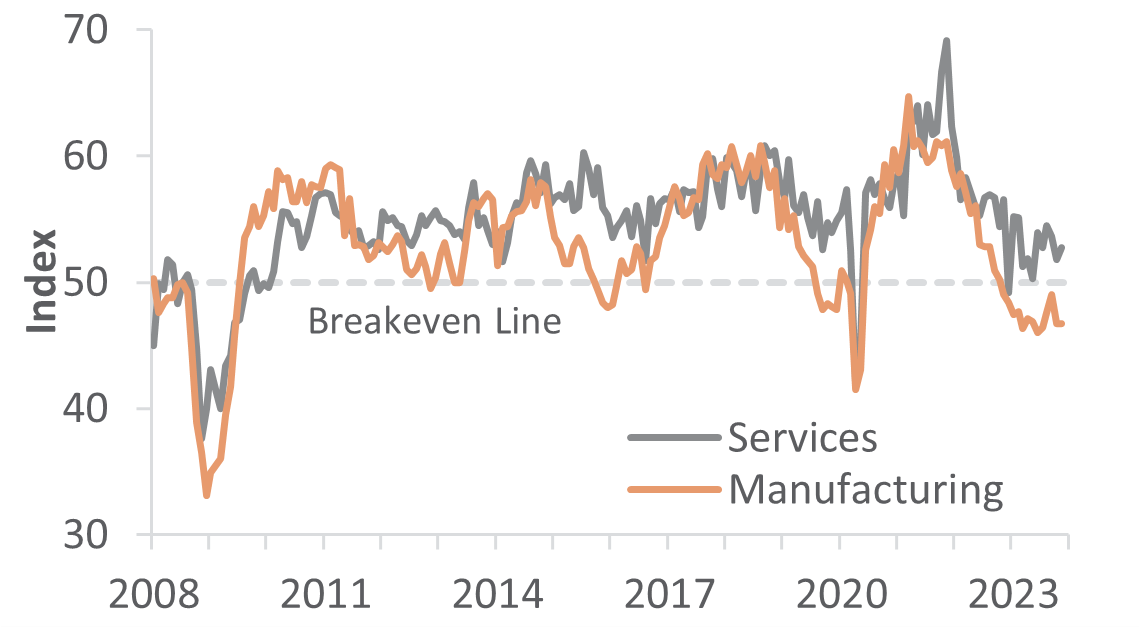
The Institute for Supply Management’s (ISM) monthly sentiment survey of U.S. manufacturers reflected slower erosion in the sector during April. The PMI registered 47.1%, up 0.8PP from March’s reading (50% is the breakpoint between contraction and expansion).

Subindexes with the largest changes included prices paid (+4.0PP), employment (+3.3PP), and customer inventories (+2.4PP). Concurrent activity in the services sector expanded at a modestly faster pace (+0.7PP to 51.9%). Exports (+17.2PP), inventory sentiment (-9.0PP), and imports (+7.7PP) exhibited the largest changes.
Changes in S&P Global’s survey headline results were generally consistent with ISM’s. Both manufacturing headline indexes rose, although ISM’s reflected slower contraction while S&P Global’s nudged back into expansion. Both services reports exhibited stronger overall activity.
“U.S. manufacturing output has regained some encouraging momentum at the start of 2Q, having stabilized in March after four months of decline,” wrote S&P Global’s Chris Williamson. “The brightening demand picture was accompanied by a lifting of business confidence about the outlook and increased hiring. The downside was a reigniting of inflationary pressures, with a stronger order book encouraging more firms to pass through higher costs to customers.”
Price Indexes Mostly Unchanged with Mixed Bag in Forest Products
The consumer price index (CPI) rose 0.1% in March (+5.0% year-over-year, the smallest increase since May 2021). This more than offset a decline in the energy index at -3.5% MoM and -6.4% year-over-year. All major energy component indexes declined as well.
Meanwhile, the producer price index (PPI) declined 0.5% (+2.7% year-over-year). Two-thirds of the March decline in the final-demand index came from a 1.0% decrease in prices for goods with a drop of 11.7% in gas prices. The index for final demand services moved down 0.3%, led by a 7.3% drop for machinery and vehicle wholesaling.
In the forest products sector, numbers came down rather mixed in the most recent report:
- Pulp, Paper & Allied Products +3.5% year-over-year (no change)
- Lumber & Wood Products -0.5% (-18.3% year-over-year)
- Softwood Lumber: -0.9% (‑49.3% year-over-year)
- Wood Fiber: +1.1% (-0.7% year-over-year)
Forest Products Intelligence from Forest2Market, a ResourceWise Company
This post was a small excerpt from Forest2Market's monthly Economic Outlook report. The EO is a macroeconomic indicator forecast highlighting general economic trends and related data. It also includes our experts’ insights and predictions about what to expect in several critical economic areas.
By understanding these economic indicators, you’ll get key information about elements such as potential future stumpage prices, buying and selling windows and more. Your business can better strategize how to manage sales, negotiate purchases and manage inventories in times of uncertainty.
Contact our team to learn more about the EO and other forecasting tools to help your business do more.


Economic Conditions Remain Unchanged, How Does This Impact the Forest Products Industry?
With economic conditions showing little variation, the forest products industry finds itself at a crucial juncture due to global conflicts and...

A Summary of the Global Forest Industry: H1 2025
The first half of 2025 was another period of dynamic change for the global forest industry. Timber, wood fiber, lumber, and biomass markets each...
Economic Contraction Slows, but Remainder of 2023 Brings Uncertainty
Economic conditions have inched up in several key indicators. But global conflicts and persistent inflation position us on the brink of recessionary...