
 Matt Elhardt
According to our transaction-based benchmark Recycled Fiber 360, spot prices have increased dramatically recently. More importantly, the "last tons" of OCC have increased even more. In this blog we are going to cover:
- How this has dramatically impacted the cost of incremental orders for linerboard machines.
- The cost structure of US linerboard compared to what average fiber prices would suggest using FisherSolve's What-If-Tool.
- The impact this will have on the margins of marginal customers for liner machines.
What Do OCC Spot Prices Currently Look Like?
Recently, there has been a rapid surge in spot prices for Old Corrugated Containers (OCC)—surpassing the rates reported by other data providers. This significant increase is evident in Recycled Fiber 360, our comprehensive transaction-based price benchmarking system containing tens of thousands of purchase orders worth of data each month.
Figure 1: OCC Spot vs Contract Prices

Source: Recycled Fiber 360
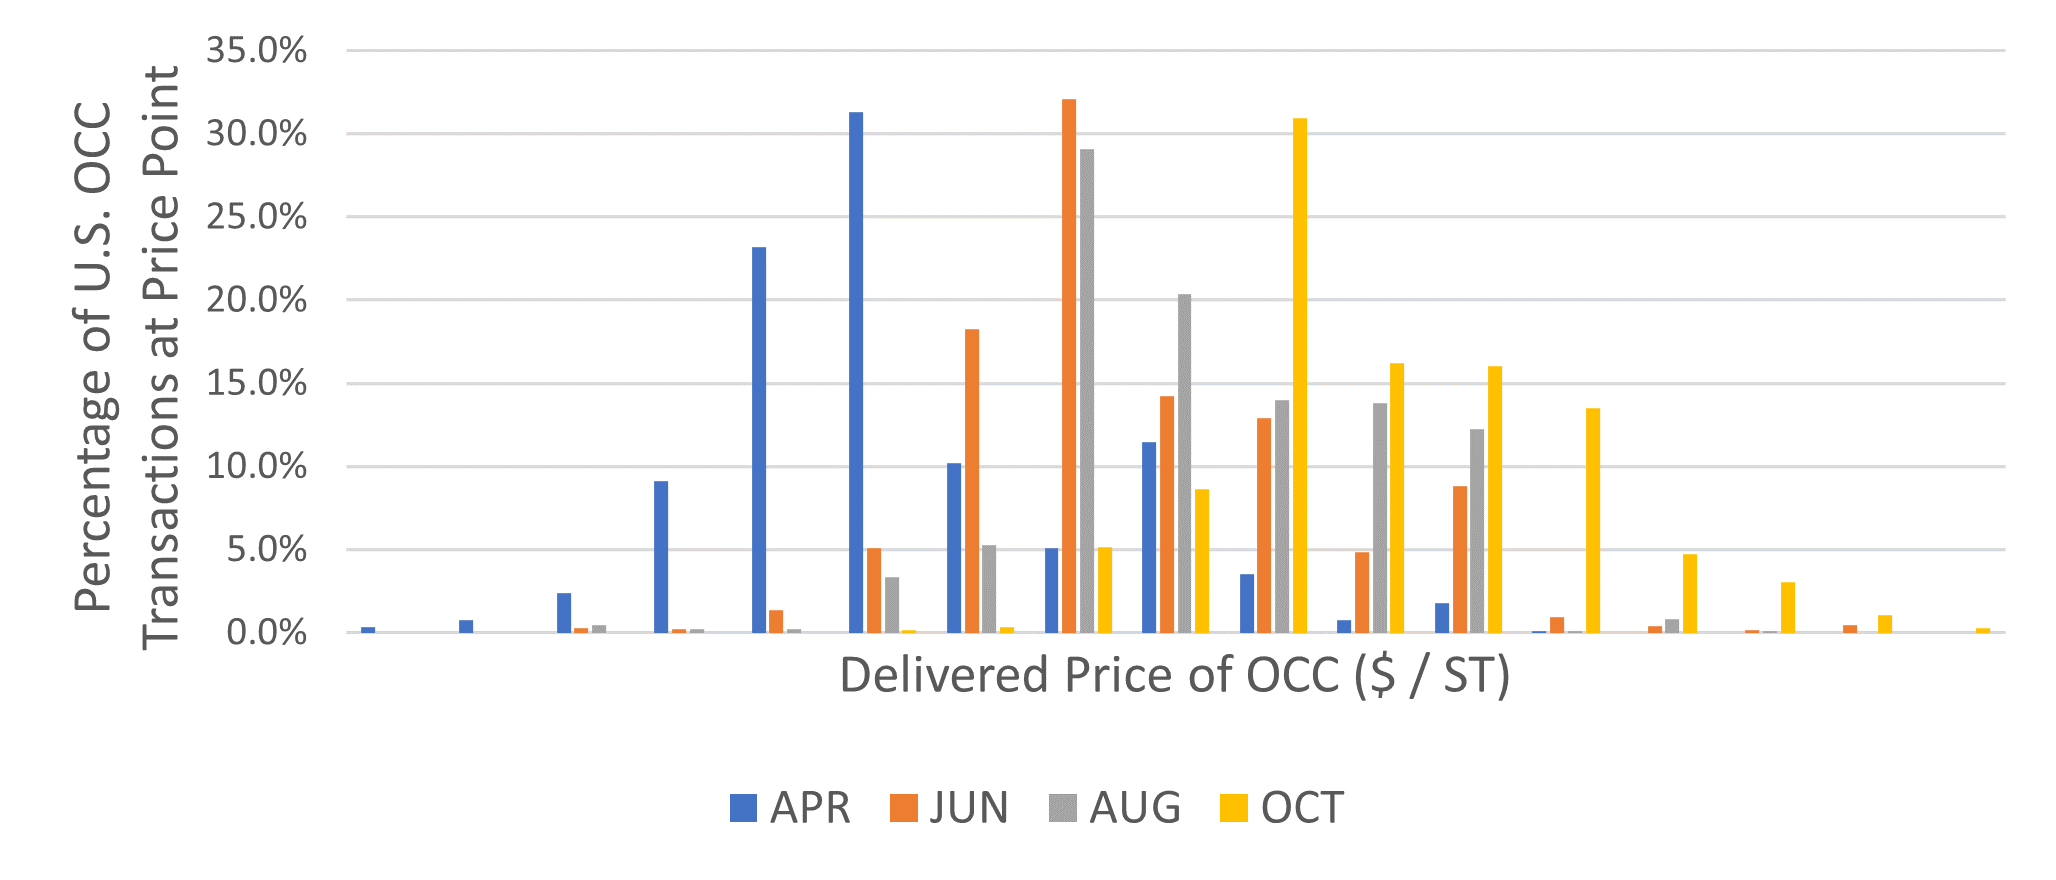
The rise in spot prices not only leads to an increase in averages, but more importantly, it results in a rapid increase in the marginal price for the last ton of OCC. This can be seen in the chart below using data from Recycled Fiber 360.
Figure 2: Price Distribution (Fiber Supply Curves) of the Percentage of Volume Transacted per Price Tranche

What Impact Does This Have on Mills?
Why does this matter? With the increasing demand for linerboard, paper machines now have a wider range of orders to choose from in the market. This creates a scenario where mills have to strategically manage their mix of orders to optimize profit on a per-machine hour basis.
While some mills still rely on standard costing systems, the best approach is to evaluate these orders using marginal economics. In other words, it's crucial to consider the cost of the last input required to produce each ton of paper.
Most direct costs to make paper are inelastic to production—meaning they don’t increase as paper production increases. This is largely because supply is so much larger than demand just from the paper industry.
Energy is an easy example. No one would argue that demand fluctuations in the paper industry are enough to change pricing in the global oil market.
OCC, however, stands out from other commodities due to its unique price determination process. Its price is influenced by both its supply and demand, which are intricately connected. This is because you can only obtain OCC if you produce it, and there is no demand for OCC unless there is a need to manufacture more paper.
In our OCC forecast models, we refer to this phenomenon as "the demand ratio." It serves as the primary driving force behind the fluctuation of OCC prices beyond its floor price or the cost of collection.
As we can see in Figure 2, the upward surge in OCC prices affects the overall average movement while also significantly impacting the marginal price of the last ton. This has serious implications for the economics of selling the final ton of linerboard.
In the figures below, we show costs for US containerboard (linerboard and medium) delivered to Chicago, a large corrugating market. The cost curve highlights mills that are recycled (blue), virgin (green), and virgin and recycled (pink).
Figure 3: US Containerboard Delivered to Chicago

Source: FisherSolve
What Does This Mean for Cost Competitiveness?
Looking at the chart, we can see the cost curve based on average prices from Q3 2023. Recycled mills, in blue, dominate the first quartile of the curve. This indicates their position as low-cost producers.
However, let's dive into an intriguing scenario by assessing their cost competitiveness using the current marginal OCC pricing.
By utilizing the "What-If Scenario" tool in FisherSolve, we can input the marginal prices of OCC sourced from Recycled Fiber 360 and conduct a thorough evaluation of the outcome.
Figure 4: Cost Competitiveness Using Marginal Prices of OCC

Source: FisherSolve
From the chart, we can see that not only have recycled mills' competitiveness decreased dramatically, but the highest-cost mills have pushed the end of the supply curve up as well. In these cases, it may be possible that available market prices for marginal customer orders are not profitable—even on a contribution basis.
For certain mills, knowing that your competitor is already at or above the market clearing price is invaluable in developing your own commercial strategy.
In other cases, this information is still useful in explaining to some customers the need for cost recovery. This is especially important if they do not understand the difference between average input price movements and the radical difference in marginal prices.
Discover how Recycled Fiber 360 can empower you and keep you at the forefront of the industry. Dive deeper into the insights and benefits of our invaluable tool by downloading our free eBook.


DOE’s Updated 45Z GREET Model Brings Clarity to US Biofuels Markets

EUDR Compliance in 2026: Why Traceability Has Become a Competitive Advantage

How Will Decarbonization Drive the Pulp and Paper Industry?
When looking forward at the forces that are likely to drive the direction of the pulp and paper industry over the next 15 years, decarbonization and...
China’s Pulp and Paper Expansion: How Overcapacity Is Reshaping Global Competitiveness
China’s pulp and paper industry continues to expand at an unprecedented pace, with new mill projects, advanced technologies, and state-backed...
A Technical Look at Pulp & Paper Fiber
Let’s take a very simplified and quick look around the Pulp World. Cellulosic pulps are comprised of basically the same materials, cellulose...