3 min read
Benchmarking Water Usage: An Increasingly Important Metric for Pulp & Paper Producers
 Matt Elhardt
:
Mar 31, 2022 12:00:00 AM
Pursuing eco-friendly business practices and prioritizing sustainability issues continues to be a major initiative across a number of global industries. We’ve discussed this trend among the largest global corporations such as Apple, Starbucks, Nike, etc., who have already committed to ambitious sustainability targets to become carbon neutral within the next 30 years — and many others are following suit. While much of the dominant narrative has thus far focused on climate change and carbon impacts, there is another major component at play: water scarcity.
The topic of water scarcity has forced its way into the sustainability discussion, especially as droughts have gripped portions of the western US and other extreme drought crises have created humanitarian disasters globally. As water management becomes a more sensitive issue, companies are beginning to set water use and reduction targets. For example, at the end of August, Facebook announced a goal to be water positive by 2030. The tech giant has already invested in water restoration projects that will replenish more than 850 million gallons of water per year and, in regions experiencing high levels of water stress, these projects already restored nearly 600 million gallons of water in 2020. Google also made a similar announcement stating the company is pledging to be water positive 2030 and will support water security in communities where they operate.
The Pulp & Paper industry is actually one of the largest consumers of industrial process water in the US and the second largest in Europe, as water is used within 85% of all three stages of paper production (pulp making, pulp processing and paper/paper board manufacturing). Since such a significant amount of the water used in the manufacturing processing, large volumes of contaminated wastewater are produced.
Water supply issues are also becoming an increasingly important factor for many different industries as well. The mining sector, for example, has experienced increasing water stress globally with the steady trajectory in demand growth that has impacted almost all mined commodities over the past 20 years, resulting in increased demand for water at mining operations. The oil and gas industry also plays an important role in protecting the quality of water in areas in which it operates.
Fisher International believes that as global consumer understanding of these issues expands, corporate stewardship of water resources will become increasingly important (much in the way “carbon footprint” has become a standard metric), and likely, a part of its license to operate in a world increasingly aware of Environmental, Social & Governance (ESG) issues.
Manufacturing viability is increasingly defined by transparency into these metrics. Companies seeking to benchmark their own water stewardship performance, or that of their suppliers, can use Fisher’s Water Intensity Index to benchmark the water conservation performance of mills (measured in volume of water per ton of production). These values can be compared for mills, companies or regions and can be analyzed in the context of water risk for any given area(s). This data can now be used by consumers of pulp and paper products to benchmark their suppliers, which as mentioned earlier, is a factor more consumers are taking into consideration during the purchasing process.
To get a better understanding of how this works, let’s take Kraft Pulp mills as an example. Pulp is a product that is made in different regions and traded globally, and it is used for a variety of paper grades from tissue to packaging. Because of this diversity and its global nature, pulp is a compelling grade for benchmarking. Through the FisherSolve platform, one can find accurate data benchmarking of the total water used at a specific mill, how efficient the mill is in terms of water used per ton of pulp/paper produced, and a water risk assessment for the site in which the mill is located.
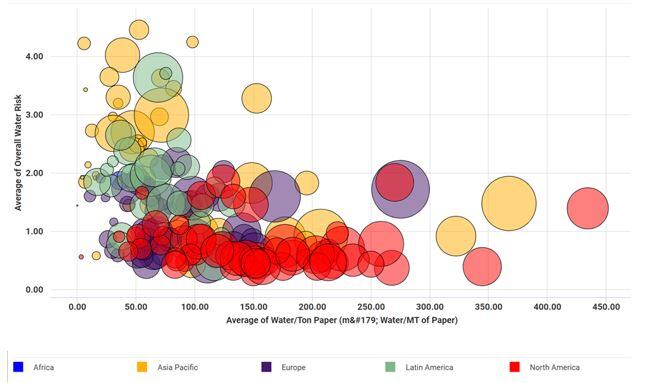
Water Risk is assessed by the World Resources Institute per the Aqueduct™ that assesses each area’s total water risk based on scarcity, regulatory and quality measures. A high water risk score indicates that the area in which a mill is situated is at risk to water-related issues — including quality, scarcity or regulatory issues. In other words, a mill in the middle east that is using a lot of water might be higher risk than a similar mill on a large river in Russia.
In the chart below, we can visualize three pieces of information about global Kraft Pulp mills: the average water intensity (x axis), the water risk in the area the mill is located (y axis), and the total volume of water consumed at the mill (bubble size). The color of the bubble indicates the region in which the mill is located.
Water Consumption by Mill

Source: FisherSolve Next
FisherSolve users can then drill down into the details to benchmark individual mills and companies, which is useful for both buyers of pulp and competitors alike. In the chart below, we have plotted water intensity data for two major producers of hardwood market pulp. From the chart, we can see that the “blue” company’s operations are nearly twice as water-intensive as the “orange” company’s. Increasingly, as conservation, circular economics, and ESG initiatives drive consumer and corporate behaviors, will the “blue” company be disadvantaged? We think it is only a matter of time until that answer is a resounding “Yes”.
 Source: FisherSolve Next
For more information on how Fisher’s Water Intensity Index and other sustainability-related benchmarking tools can help provide your company with the information needed to maintain a competitive edge within the industry, talk to an expert today.


