
 Jane Denny

In today’s money, the first comprehensive world market paraxylene survey ever published would set a buyer back US$33,000. In fact, it was the compilation of this comprehensive report in Houston, Texas, during December 1976 that launched the enterprise that underpins ResourceWise’s chemicals expertise.
One of the world's longest active petrochemicals consultancies, Tecnon OrbiChem— which co-authored the original paraxylene report with DeWitt—was acquired by ResourceWise in 2019.
Now, nearly 50 years after that first world paraxylene market study was published, ResourceWise is launching a price forecast for this valuable aromatic hydrocarbon feedstock.
What Value Do Paraxylene Price Forecasts add?
But why introduce a paraxylene-focused ChemForesight now? One reason is that this key chemical intermediate has demonstrated intense volatility since the decade began.
Another is that, with well over 500 Polyester & Intermediates ChemFocus issues under our belt from the past nearly 43 years, we have the expertise and insight necessary to forecast prices at least 18 months in advance. That is the kind of prediction businesses need to optimize opportunities.
Paraxylene (PX) is one of the trio of xylenes obtained via the catalytic reformation of naphtha—alongside metaxylene and orthoxylene (OX), which are all extracted from mixed xylenes. PX has the largest addressable market. In fact, its marketplace is several times larger than the other two combined.
Fibers, Resins, and Thermoplastics Intersection
PX is used to make purified terephthalic acid (PTA), the main component of polyethylene terephthalate (PET), one of the world’s largest volume polymers. Without PET, the fibers, resins, films, and blown beverage bottles we rely on as consumers would be scarce.
PX is also used to make dimethyl terephthalate, a feedstock for the resin polymer polybutylene terephthalate (PBT). A hard-wearing thermoplastic, PBT is used in applications including electrical housings, automotive brackets, and oven door handles.
Rising demand for purified terephthalic acid and aromatic chemicals are the key drivers behind the market's growth.

Paraxylenes: A Global Snapshot
Worldwide, over 57 million metric tons of paraxylene were produced in 2023, with more than 90% of the total produced in Asia and China. The Middle East, West Europe and North America trailed far behind in output last year, producing just under 5 million metric tons between them.
That said, according to OrbiChem360, capacity utilization for PX worldwide in 2023 was almost the lowest it has been since 2014.
Utilization rates only dipped one percentage point lower than last year’s in 2020. That was the direct result of Covid-19 decimating world markets before manufacturing recalibrated to the pandemic's new normal.
China’s lead in terms of paraxylene production capacity and output is a relatively new phenomenon. In fact, until 2018, the country had a relatively undeveloped paraxylene market.
China's Paraxylene Pivot
Around a decade ago, PX was highly demonized among Chinese communities, with protests when petrochemical companies first began to consider expansion to meet China’s growing domestic demand. A special forum was held in Beijing in the Spring of 2014 to address a wary public and make way for new sites. There are now 26 plants in China with outputs from the low hundreds of thousands of tons per year to several million tons per year. Overall capacity increased more than threefold over the last six years.
Middle Eastern output of PX has generally risen since 2017. This year, however, a jump of around 1.8 million tons in production compared with last year is expected as new plants come onstream. Early in the 2000s, the region was a marginal paraxylene producer with a capacity that accounted for just 4% of the world's total. Its capacity jumped to more than 2000 ktpa in 2007, then doubled by 2014, as shown in Orbichem360 archives. By comparison, output in North America, West Europe, and East Europe has shrunk by 50% since 2014.

Source: ResourceWise, OrbiChem360
The graph above shows the breakdown of global production capacity by region in 2024. The yellow region (at the 12 o'clock position) represents South America—namely Brazil—with its circa 200 ktpa output capacity. Brazil's only PX producer is petrochemicals, chemicals, and resins manufacturer Braskem.
Paraxylene Trade Flow in 2023
Even China’s hugely expanded production capacity does not provide the country with enough paraxylene to meet demand. The Trade Flow graphic from our chemicals business intelligence platform shows that South Korea exported 4 million tons to China during the year. The remaining nearly 5,000 kilotons China needed came via Japan, Taiwan, Brunei, Singapore, and Malaysia.

Source: ResourceWise, OrbiChem360
The US, which (as stated) has a relatively limited PX output, exported 714 kt to Mexico in 2023. The US imported over half this volume from Saudi Arabian producers.
Reliance Industries—with an annual capacity exceeding 4 million tons—is India's main PX producer, with two smaller enterprises, with an output of 2000 ktpa combined. Malaysia, Indonesia, and the US were India's main export destinations for PX in 2023. The country did, however, import some PX from Singapore.

Source: ResourceWise, OrbiChem360
Pricing Structures for Paraxylene
Before 2022, cross-region prices for paraxylene were very much in line and synchronized. This can be seen in the graph above, which shows one spot price per region – North America, West Europe, and South and Southeast Asia. These three spot prices represent a range of prices currently available in OrbiChem360. The remaining five are contract prices for those regions, plus another contract price for mainland China.
As the price graph above shows, Covid-19 caused no significant price divergence between the three regions’ paraxylene price points. This is because, by and large, all regions were equally impacted by the pandemic. Another reason the prices for PX generally mirror one another regardless of region is that PX is relatively easily transported globally.
But things changed in early 2022 with the onset of the Russia/Ukraine war. The resulting shipping disruption—particularly impacting cargoes leaving Asia bound for worldwide destinations—has led to the ongoing price gaps between the different regions.
The United States "Gasoline Effect"
When PX began to demonstrate price gaps in markets regionally, the US was hit harder than any other region. This is due to what is known as the "gasoline effect".
Gasoline needs octane and one of the sources for that is the gasoline blend stock reformate. This component contains mixed xylenes, which can be used directly for blending into gasoline or as a solvent. Xylenes have a value which is dependent on their octane value.
Another round of demand growth may emerge in the US in the short term. Potentially, there will be higher PX values and greater PX price gaps versus Asia.
Javier Rivera, Business Manager, Chemicals, ResourceWise
Companies buying mixed xylenes to make PX must pay a price point determined by the gasoline price. Today, the spot price for PX in the US is 50% higher than the price for import spot PX in South and Southeast Asia.
Inflated PX prices in early 2024 in the US were coming before the country's driving season even started. Market participants were reporting a stronger octane market, seemingly making early preparations for the US driving season, says Javier Rivera, Business Manager, Chemicals ResourceWise.
 Rivera (pictured right) monitors PX as part of his focus on PET and polyester markets worldwide. He says price gaps of the magnitude observed in mid-2022 are not expected to occur again.
"But, another round of demand growth may emerge in the US in the short term. Potentially, there will be higher PX values and greater PX price gaps versus Asia in the coming months than we have seen so far this year.
“In Asia and China, after a long period of high PX operating rates, high inventories will continue to put pressure on PX spot prices and force lower operating rates. PX spreads over naphtha are expected to be stable or lower,” Rivera adds.
Dangote Promises Paraxylene Balance
But when will paraxylene markets begin to balance? "The Dangote Oil Refinery (Nigeria), with a processing capacity of 650,000 barrels per day (bpd), and the Dos Bocas Refinery (Mexico), which will process 340,000 bpd, are set to reshape gasoline markets in Africa and Latin America, and beyond, challenging the established dominance of refineries in Europe and the United States.
"These two regions, historically reliant on refined fuel imports from Europe and the US, are now on the brink of self-sufficiency. As the Dangote and Dos Bocas refineries ramp up production, the global refining industry is entering a new era of competition and realignment. This means that African and Latin American countries, once heavily reliant on imports from the US and Europe, will position themselves as significant players in the international fuel market," Rivera explains.
ResourceWise now brings ChemForesight methodology to its paraxylene price indexes and insights in a bid to assist chemicals markets procurement professionals and planners. ChemForesight analysts use the 'Tecnon OrbiChem' proprietary algorithm to assess markets and track the relative effect of three crude oil price scenarios 18 months in advance.
The base case reflects our median prognosis. Alongside the base case are scenarios reflecting higher and lower price trends that take into account market drivers, including predicted market tightness, which varies according to shifting market needs, feedstock availability, plant downtime, production economics and many other factors.


DOE’s Updated 45Z GREET Model Brings Clarity to US Biofuels Markets

EUDR Compliance in 2026: Why Traceability Has Become a Competitive Advantage
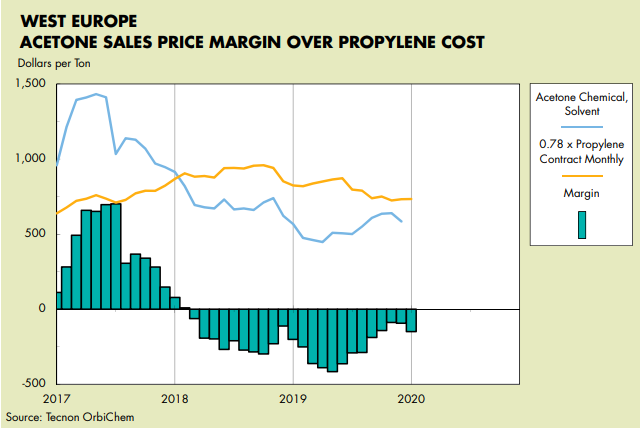
Reversal of Fortune for Acetone?
Acetone prices have been in perpetual hell for the last 18 months - values plunged to historical lows in mid to late 2019, falling significantly...

Maleic Markets Reel as Feedstocks Prices Drop and Demand Falters
As crude oil and all related markets fell with shocking speed in response to deepening fears over the impact of the COVID-19 pandemic, the maleic...
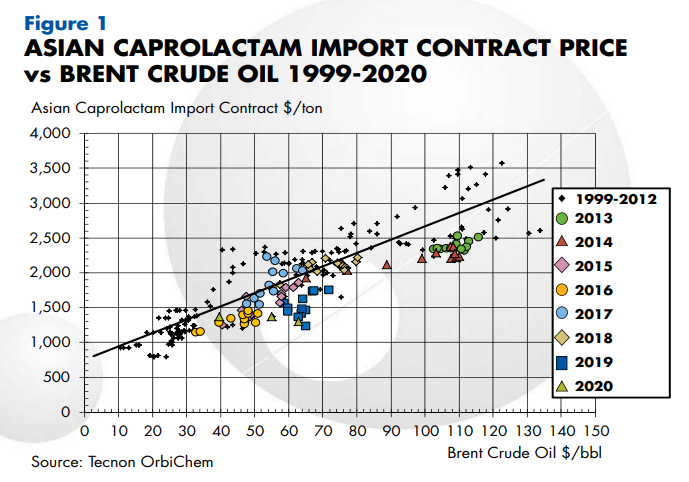
Cheap Crude Oil Helps Some Chemicals More Than Others
In the space of 11 weeks we have seen Brent crude oil prices fall from just under $70/bbl to $29/bbl. Lower crude oil prices are generally welcomed...