
 Charles Fryer

Chlor-alkali plants produce caustic soda and chlorine in fixed proportions, 1.10:1.00, respectively, by weight. However, market demand is not fixed in this proportion. It can swing from a caustic soda shortage when the market demand ratio is >1.10:1.00, to a caustic soda surplus when the market demand ratio is <1.10:1.00. Such a market evolution usually causes a swing from high caustic soda prices to low caustic soda prices in parallel. Chlorine demand and prices go through an analogous market, and price changes are the inverse of those seen for caustic soda.

These swings result in demand and pricing for the two outputs of chlor-alkali plants tending to move up and down in cycles in the long term, with the cycles 180 degrees out of phase with each other for the two products. This tendency was illustrated in Charles Fryer's presentation to the World Chlor-Alkali Conference in June 2023 and earlier in this annual conference (Fig. 3).
The market behavior was analyzed and broken down schematically to be summarized in diagrammatic form by the five numbered arrows in that graph. The upper two graphics in the attachment enable us to check to what extent this characterization summarises the reality of market behaviour. The monitor of caustic soda prices that has been taken is the contract price in Northwest Europe. For chlorine, market prices are not transparent, and the monitor we have chosen as a surrogate is the spot import price of ethylene dichloride in Northeast Asia (Fig. 1).

At the time of the presentation, June 2023, the chlor-alkali market's status approximated the green ball's position in the cycles diagram. The chlorine price had collapsed from late 2021 to late 2022, which can be taken as corresponding to arrows numbered ③ and ④ in the cycles diagram. Conversely, the caustic soda price had reached a maximum in that period, corresponding to ④. Then, the period from late 2022 to June 2023 saw stagnation at a low level of the chlorine price, and a collapse in the caustic soda price, corresponding with ⑤.
 Now, let us see if the model predicted the price profiles for the following 24 months from June 2023, up to June 2025, with reasonable accuracy. The third quarter (Q3) of 2023 showed a modest improvement in the chlorine price and stagnation of the caustic soda price, roughly corresponding to ①. Then Q4 2023 and Q1 2024 witnessed a stagnation in the chlorine price and a rise in the caustic soda price (albeit modest), corresponding to ②. Next, Q2, Q3, and Q4 2024 saw a decrease in the chlorine price and a rise in the caustic soda price (again modest), corresponding to ③. The same trend followed in Q1 and Q2 2025, with chlorine prices continuing their fall and caustic soda prices remaining stable, corresponding to ④, or maybe just a continuation of ③.
At the time of writing, June 2025, the model forecasts that trend ⑤ should apply during the second half of 2025, with chlorine prices remaining depressed, and caustic soda prices falling to the historical minimum. Time will tell if this pattern plays out.
It should be clear that markets do not neatly follow the model shown in the cycles diagram but are erratic at times. Certainly, no precise price scales can be attached to the ordinate and abscissa of the graphic. However, the graphic does help in understanding the behaviour of chlor-alkali markets and indeed in judging future trends in pricing of chlorine derivatives and caustic soda at any given moment in the cycle.

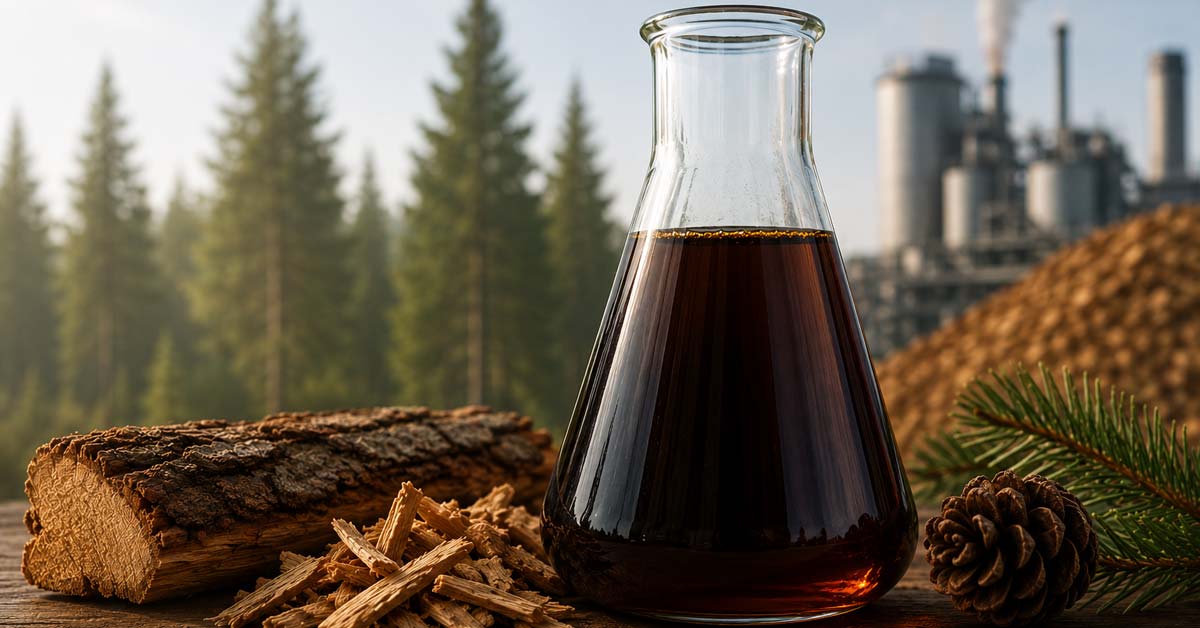
Crude Tall Oil Is Gaining Value in Low-Carbon Fuel Markets

How SAF Demand Is Reshaping Forest-Based Feedstock Markets
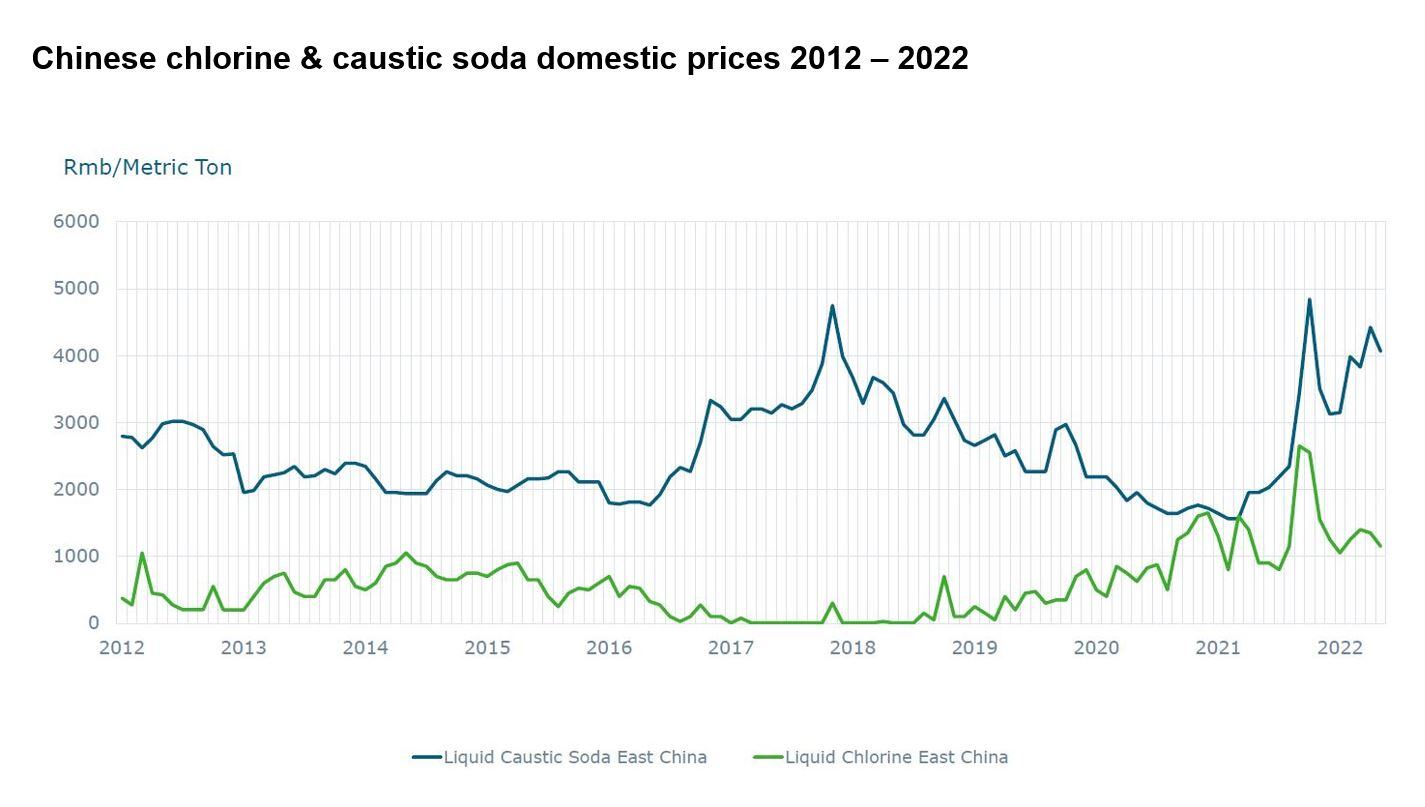
Chlor-alkali 2022: Key Factors Driving China's Markets
China’s Dual Control Policy sharply reduced caustic soda production in the country in Q4 2021. The policy's impact on particular chemical value...
Chlor-Alkali Markets: What is Happening in 2024
The global chlor-alkali industry is locked in turbulent times. As efforts by producers to mitigate the sector’s long-term availability issues...

Chlor-Alkali in 2026: Why Market Insight Matters More Than Ever
The chlor-alkali market entered 2026 with a more complex set of pressures than in previous years. New capacity additions, shifting trade flows,...