New Residential Construction
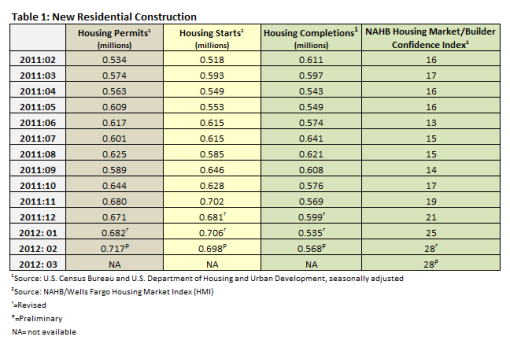
While the number of housing starts in December was revised upward to 681,000 (from 671,000) and January starts were revised upward to 706,000 (from 676,000), the number of starts fell in February to 698,000 (1.1 percent). Table 1 summarizes the Census Bureau’s February new residential construction report.
Completions were higher in February, up 6.2 percent. The best indicator comes in the permitting category, however. The number of permits issued in January was revised upward to 682,000 (from 676,000). Permits in February increased by 5.1 percent to 717,000.
Builder confidence in January was revised downward from 29 to 28, and held steady at 28 in February.
The Improving Markets Index (IMI) isolates pockets of improving conditions across the nation. In February, the IMI reported 99 markets that showed improvement for at least six months in three economic areas—housing permits, employment and housing prices. The markets, now too many to list, can be found here.
Home Sales
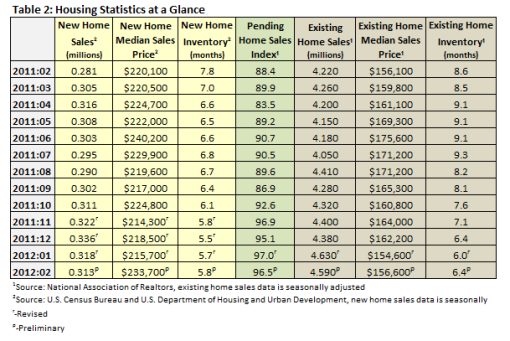
Sales of new single-family houses in February 2012 were at a seasonally adjusted annual rate of 313,000, 1.6 percent below the revised January rate of 318,000, according to estimates released jointly by the U.S. Census Bureau and the Department of Housing and Urban Development. Table 2 shows sales of new and existing homes in January as well as the pending home sales index.
The seasonally adjusted estimate of new houses for sale at the end of February was 150,000, a supply of 5.8 months at the current sales rate.
"To some extent, we believe that exceptionally good weather conditions in December helped pull some home sales forward that would otherwise have occurred in January and February, which partially accounts for the declines we've seen at the beginning of this year," said NAHB Chief Economist David Crowe. "However, the February sales rate is still 11.4 percent above its year-ago level, and the quarterly average sales pace is at a two-year high. Meanwhile, the inventory of new homes for sale remains at an all-time record low, in part because of the lack of available financing for new-home production."
According to Crowe, there was greater buying activity in the above-$200,000 range in February, an indication that those who have higher incomes and can more easily qualify for a mortgage are the ones who are moving forward with a home purchase. First-time buyers who are looking in the lower price ranges, on the other hand, appear to be having a tougher time getting qualified.
Sales of existing homes were revised upward to an annual rate of 4,630,000 in January (from 4,570,000, according to estimates released by the National Association of Realtors (NAR). In February, though, sales fell to 4,590,000, a drop of less than 1 percent.
Months of inventory increased by 6.7 percent to 6.4 months at the current sales rate; this is a 25.7 percent improvement over February 2011’s number of 8.2 months. At the end of the period, there were 2,430,000 existing homes on the market.
The Pending Home Sales Index, a forward-looking indicator based on contract signings, fell 0.5 percent in February to 96.5. This is a 9.2 percent increase over February 2011’s 89.9 reading. Lawrence Yun, NAR chief economist, said we’re seeing the continuation of an uneven but higher sales pattern. “The spring home buying season looks bright because of an elevated level of contract offers so far this year,” he said. “If activity is sustained near present levels, existing-home sales will see their best performance in five years. Based on all of the factors in the current market, that’s what we’re expecting with sales rising 7 to 10 percent in 2012.”
The Cost of Buying a Home
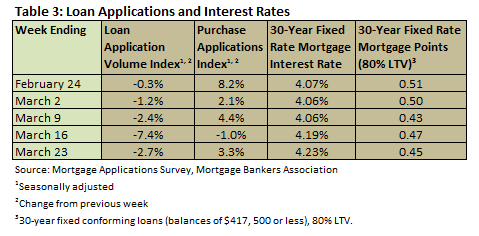
According to the Mortgage Bankers Association’s weekly mortgage application survey for the week ending February 24, the four-week moving average for the mortgage application index fell by 3.4 percent. The four-week moving average for the Purchase Index imcreased by 2.14 percent. Table 3 summarizes the weekly results of the MBA’s weekly mortgage application survey.
Mortgage interest rates began inching up in March, though they are still at historically low rates. Throughout the month, the interest rate for a 30-year fixed conforming mortgage (loan balances of $417,500 or less) remained between 4.06 and 4.23 percent, with points varying from 0.43 to 0.51. Nonconforming loans (loan balances higher than $417,500) were a quarter of a point higher and FHA loans were just under a quarter of a point lower.
Existing homes remain far more affordable than new ones. The median sales price of new houses sold in February was $233,700 (an increase of 6.2 percent over February 2011), and the median sales price of existing homes was $156,600, an increase of 0.3 percent over February 2011’s level (Table 2). This is the first time since November 2010 that existing home prices have increased year over year.
Despite these reported prices, the S&P/Case-Shiller Index (20-city composite) fell 1.1 percent in January. It is important to note however, that the Case-Shiller number is a three-month rolling index; it includes transactions that occurred from November and January. As a result, the Case-Shiller Index should most accurately be looked at as a lagging indication of home prices, not one that accurately depicts contract prices right now.
As Phil Izzo reported in the Wall Street Journal, economist Dan Greenhaus at BTIG LLC analyzed historical data about housing bubbles and home prices and concluded the following:
“Historically, housing bubbles tend to see home prices on average bottom out six years after peaking,” said. “As such, if the United States were to suffer a decidedly average housing crash, this summer would mark the point at which prices should begin turning upwards on a sustained basis.”
For a housing start forecast and further analysis of the housing market, subscribe to Forest2Market's Economic Outlook.


 Suz-Anne Kinney


